


Hello Folks,
Below you can find a recap of the topics discussed during the January Advanced Analytics office hours and those sent in that we were not able to cover in the session. Feel free to comment and continue the discussion, as well as attend our future sessions that can be found from the Community Events Calendar!
Q: We’re looking for comprehensive visibility into AI usage in our environment, including all AI apps being used, user activities, and web traffic.
A: The AI Usage Dashboard in Netskope Library is a great starting point. The dashboard provides comprehensive visibility into AI usage in your environment. Key metrics include AI app overview & usage trend, detailed user activities, instance awareness, policy actions, and web traffic generated in AI sites.
If you are looking for high-level data to gauge overall AI risk in your environment, the AI Risk Assessment Dashboard in Netskope Library is a great option.
Q: How to best use Advanced Analytics for DLP related use cases?
A: If your use cases focus on measuring DLP policy effectiveness and identifying policies that need to be tuned, we recommend starting with the DLP Policies Dashboard in Netskope Library. The dashboard provides visibility into DLP policies triggered, alerts generated, users triggering the alerts, and actions taken by the policies.
If your use cases focus on investigating DLP incidents, the DLP Incidents Status Monitoring Dashboard is a great starting point. The dashboard provides granular visibility into the DLP incidents in your environment, including incident status, incident resolution time, and policy details. Use this dashboard to investigate DLP incidents and monitor the incident response progress in your organization.
Q: What is the best dashboard that combines CASB, SWG, DLP, & overall AI reporting?
A: Currently there is not a unified dashboard that covers all these metrics, but you can easily create one based on our existing dashboards. The dashboards mentioned in the above two questions are great options for DLP and overall AI reporting. For CASB and SWG, the CASB and NG-SWG Health Check dashboards provide the insights you need.
You don’t have to create such a dashboard from scratch. If you love any widgets in these existing dashboards, you can directly save them to your own dashboard (instructions here).
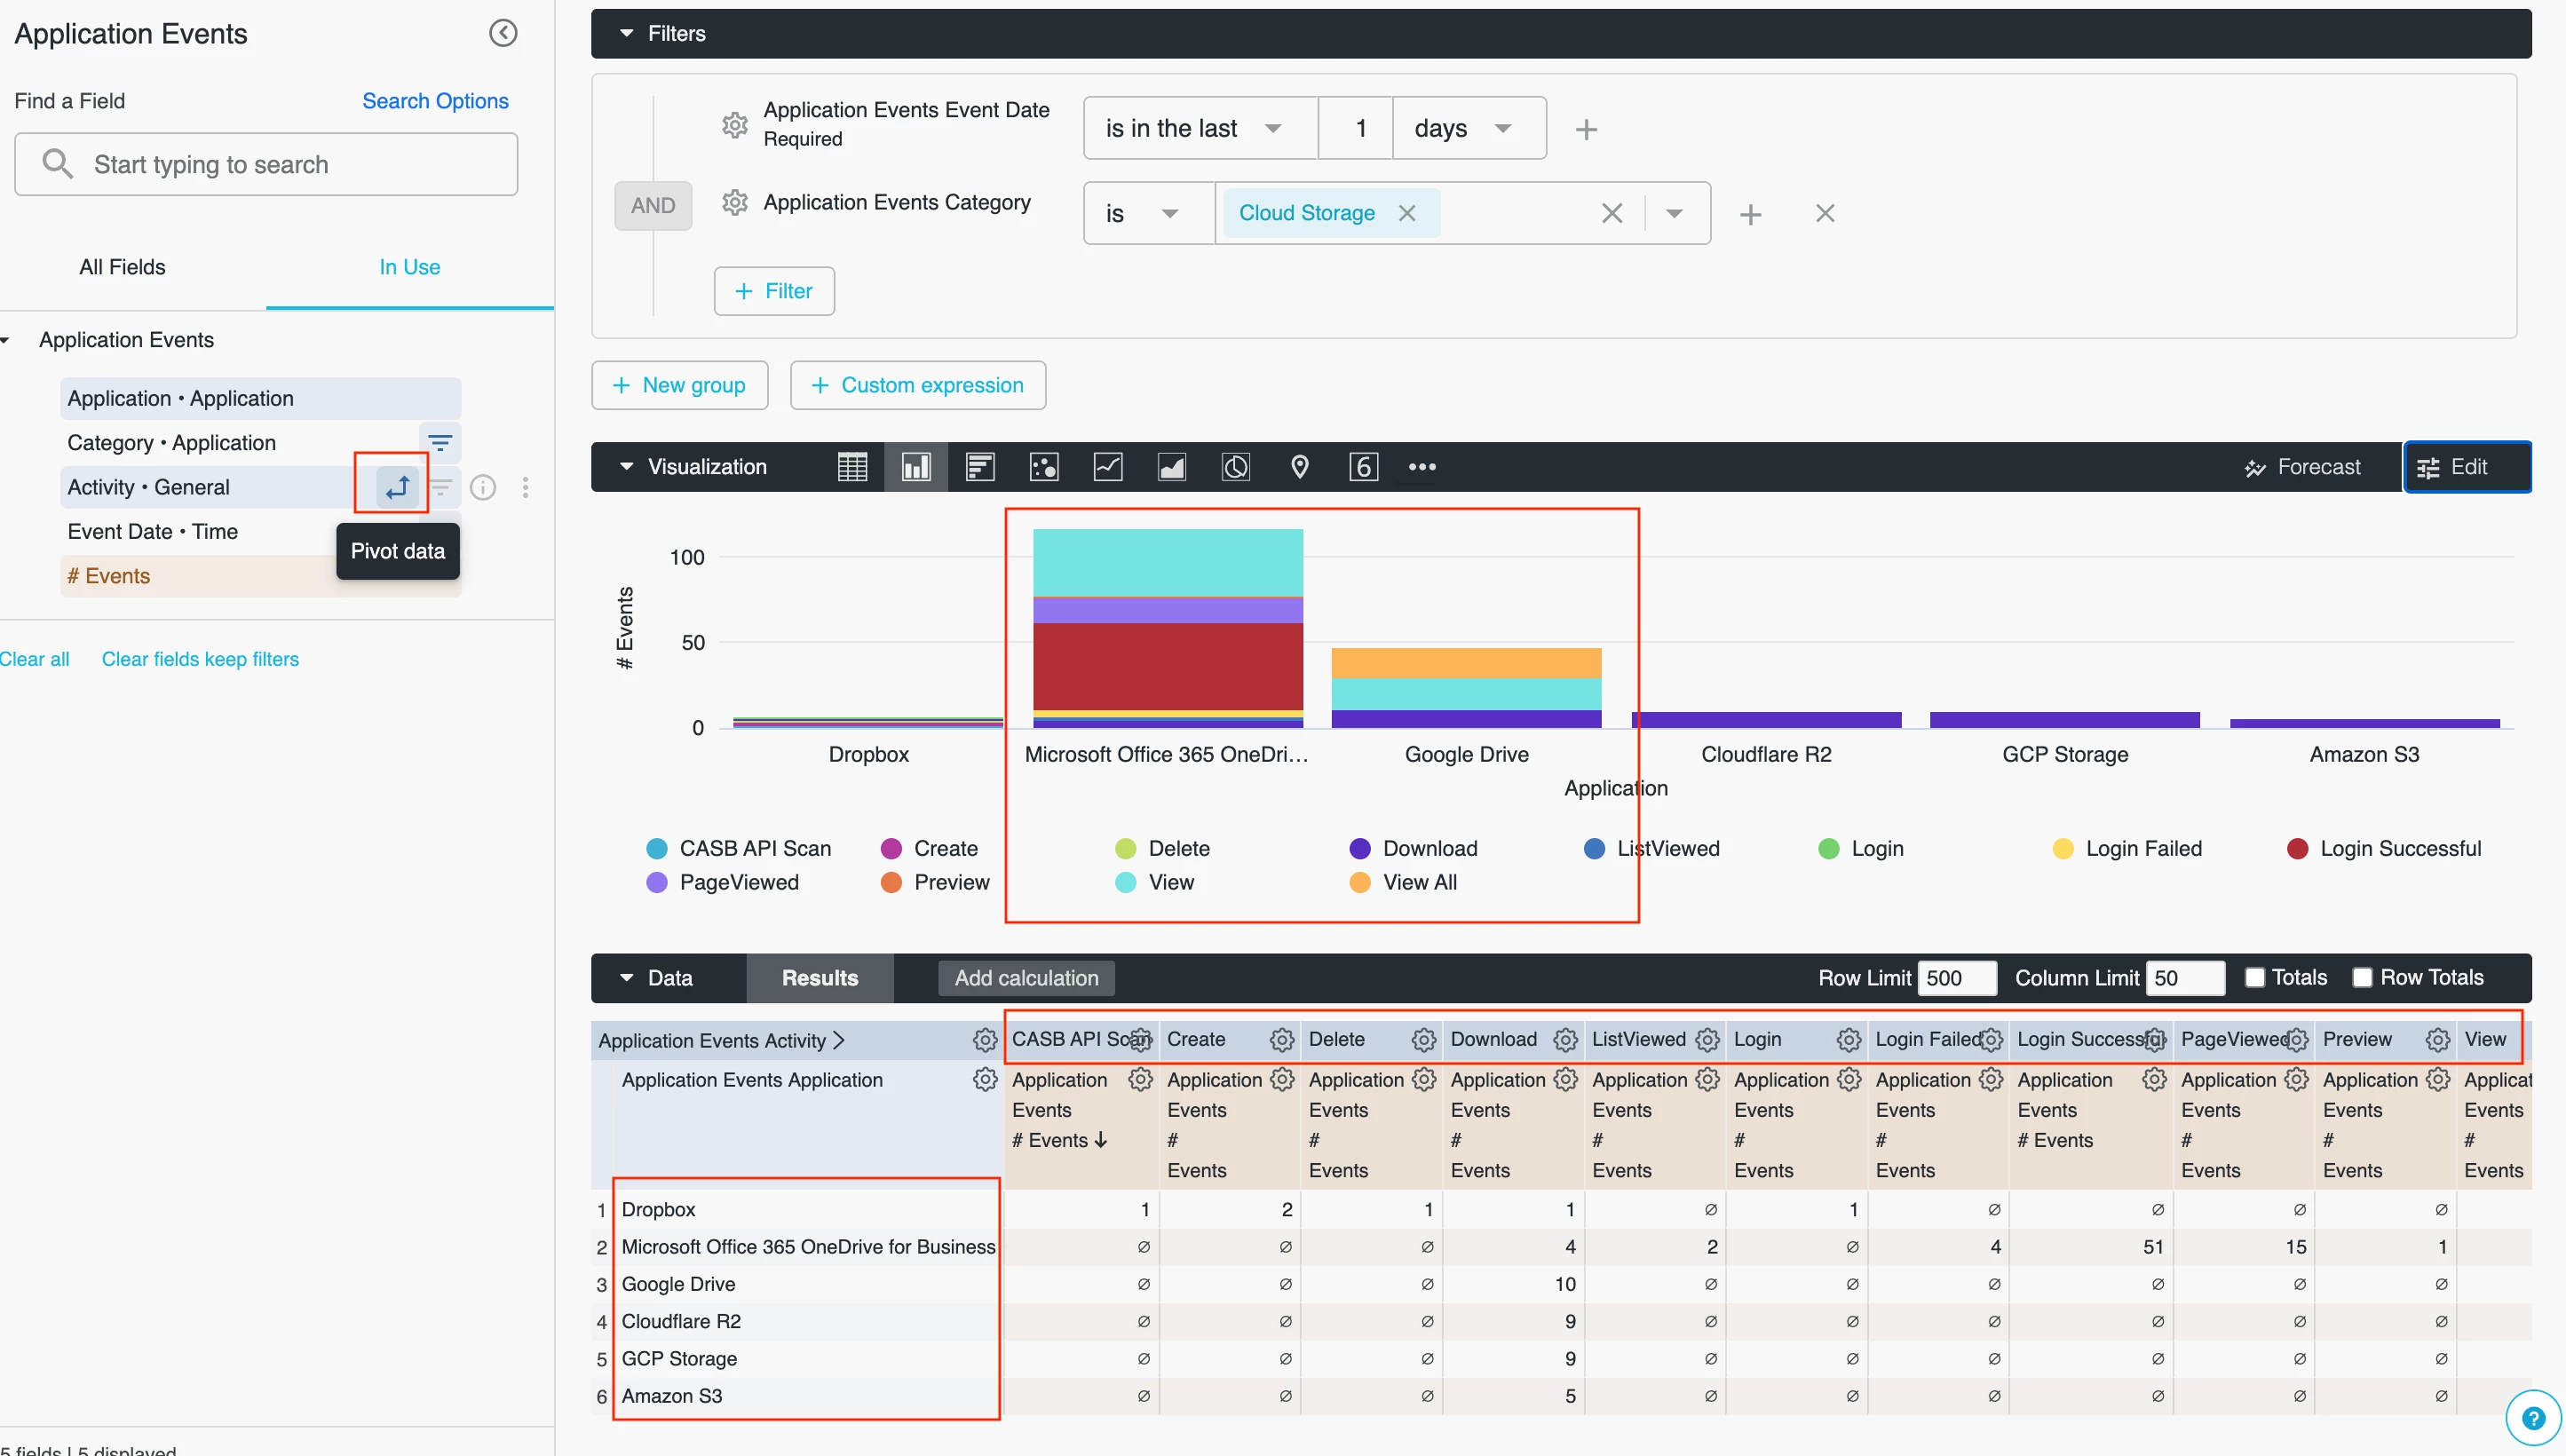
Q: How to configure charts using pivots?
A: “Pivot” allows you to aggregate the data based on your needs. For example, in a table containing “Application,” “Activity,” and “# Events,” we can leverage “pivot” to return activities detected in each application. This will stack activities into the corresponding applications and generate a more intuitive visual.
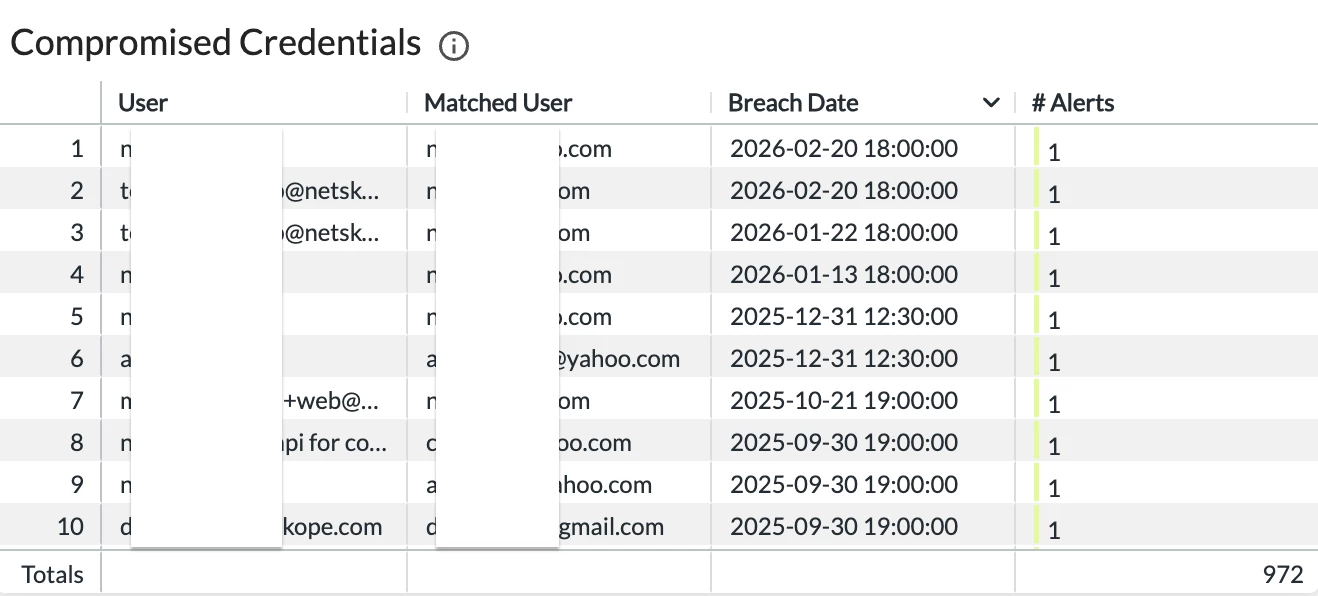
Q: Which Advanced Analytics dashboards are most effective for detecting compromised credentials & suspicious cloud session behaviors?
A: We recommend starting with the User Behavior Analytics (UBA) Dashboard in Netskope Library. The dashboard helps you monitor anomalous user behaviors in your environment by providing detailed visibility into different types of behavior analytics alerts, including compromised credentials.
If you are looking to drill into user behaviors, the User/Organization Unit Investigation Dashboard in our community will be a great option. This dashboard provides rich visibility into user activities, e.g., PCI file uploads to non-corporate instances.
Q: We’re looking to enhance our malware detection & analysis; are there any recommended dashboards?
A: Yes. The Threat Protection Dashboard in Netskope Library is a great starting point. The dashboard provides comprehensive visibility into cloud threats detected by your policies such as malware, malicious sites, & compromised credentials.
If you are interested in insider threat, e.g. intentional risky behaviors, the Insider Threat Dashboard is a great option.
Q: Is there a dashboard for API protection?
A: No, but this is on our roadmap for this year. As an interim solution, we recommend customizing the Application Risk Management Dashboard by applying the filter “Access Method == API Connector or CASB API” to get visibility into API protection.
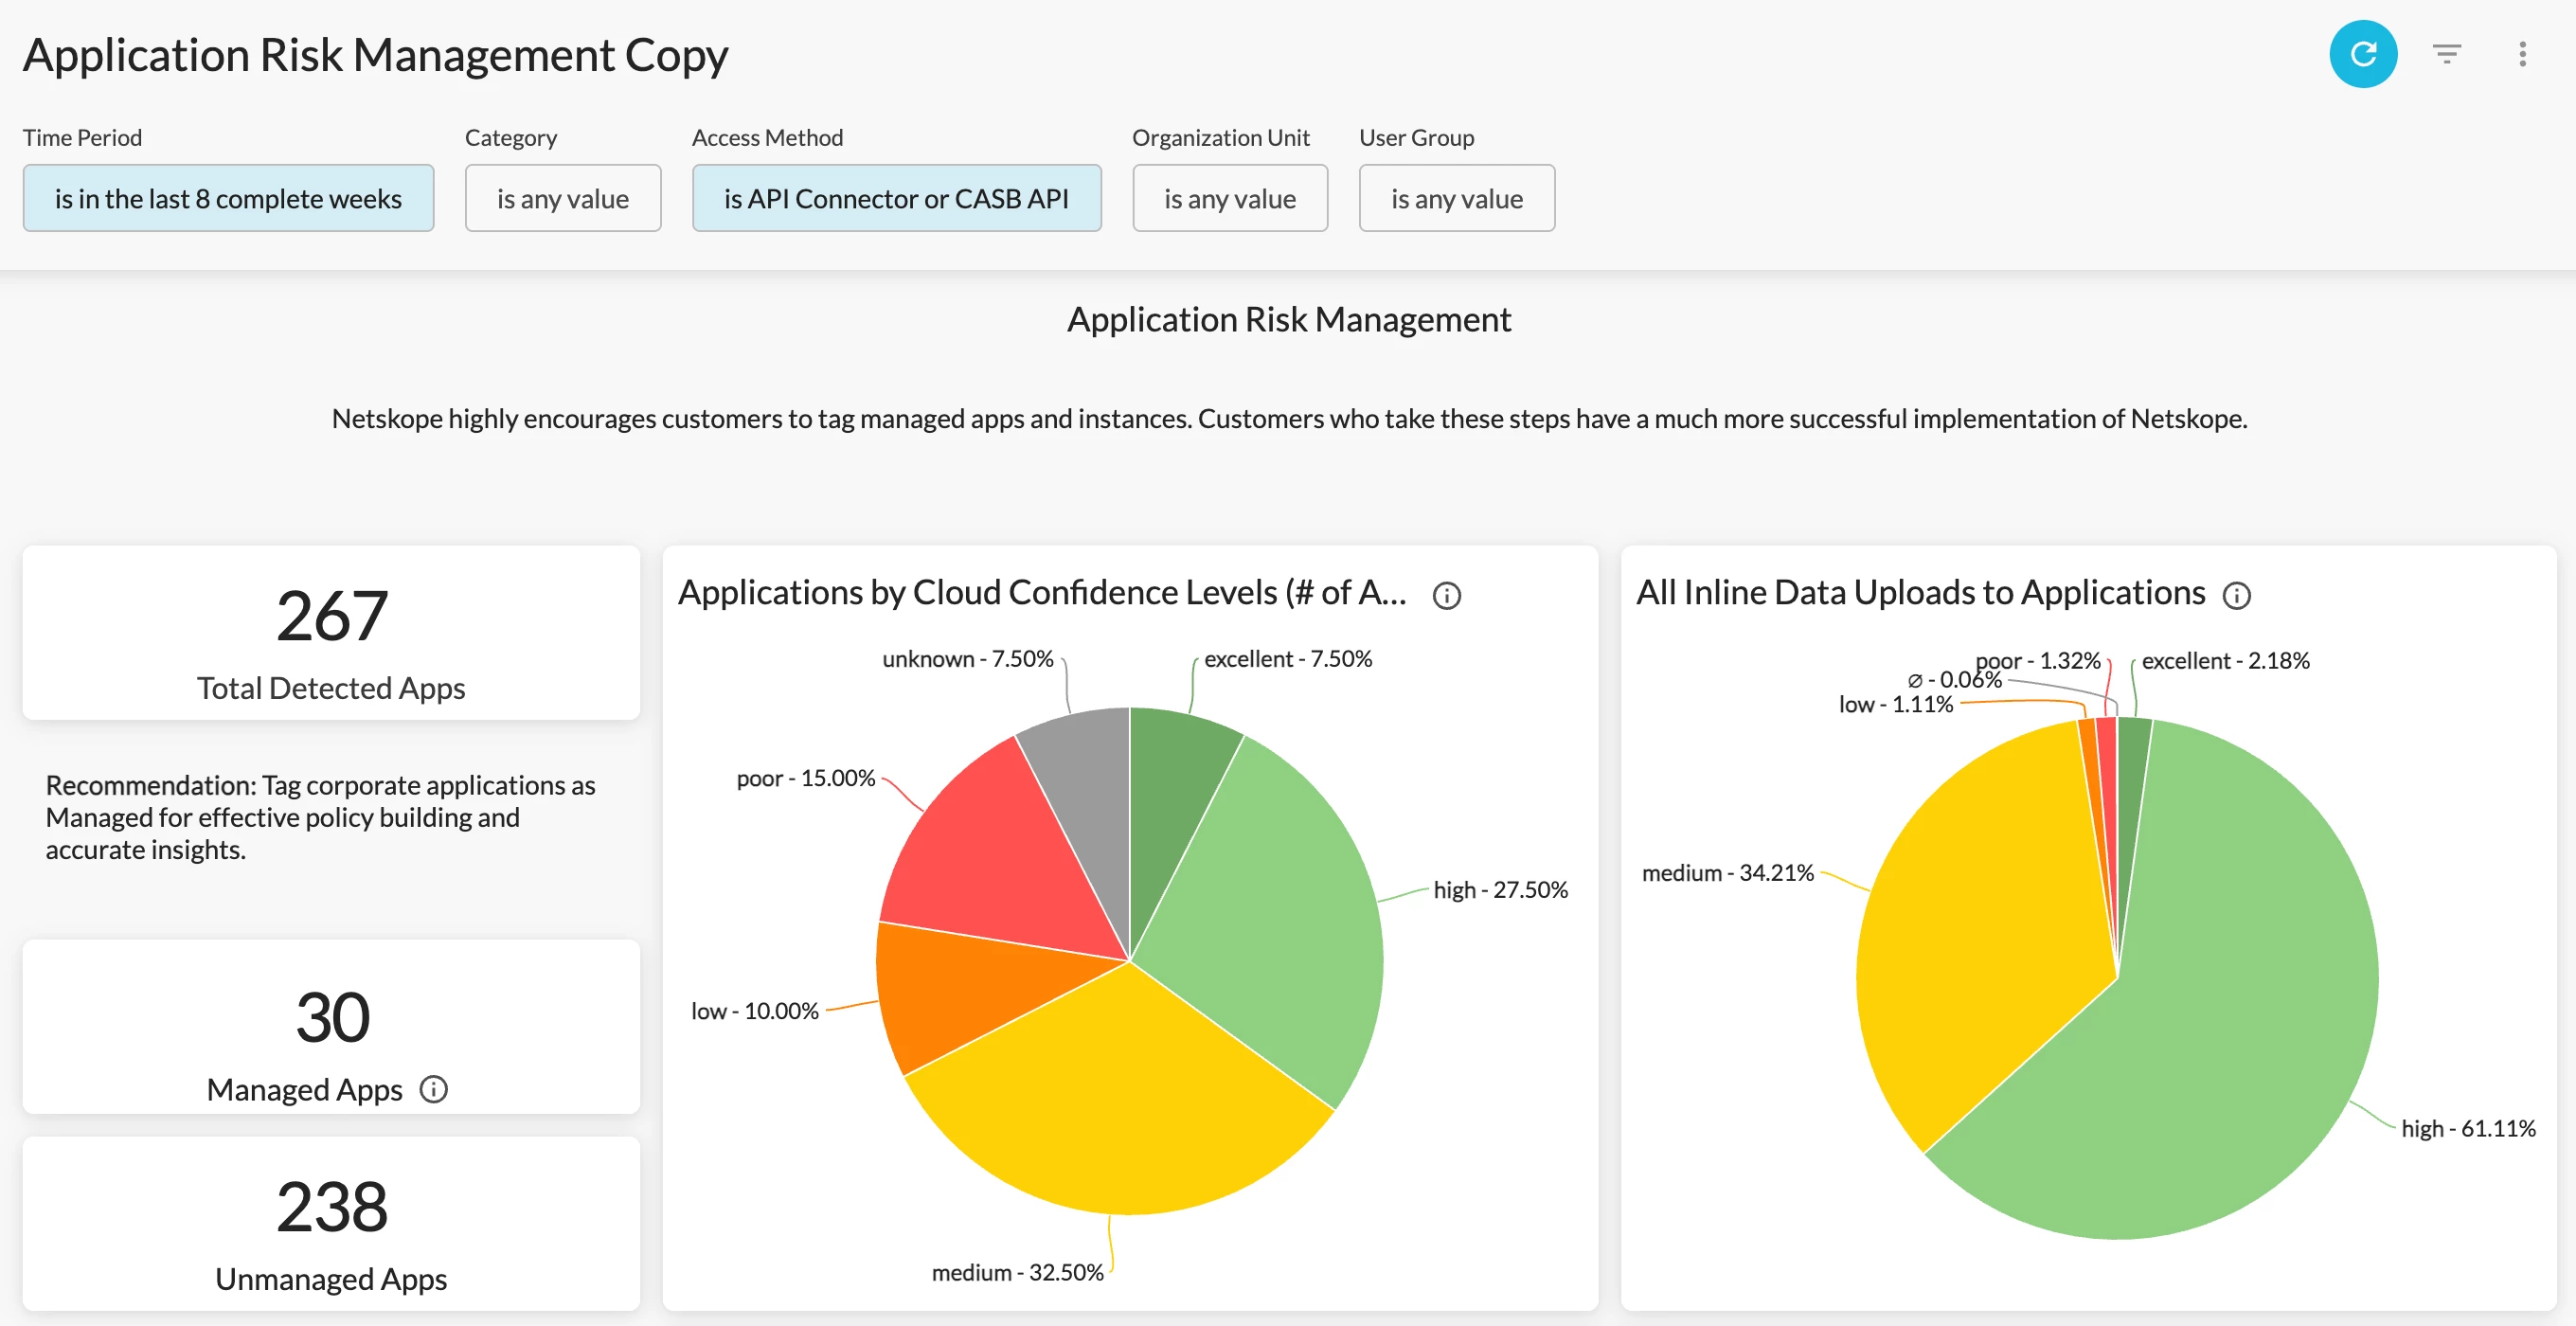
Q: Identify and monitor shadow IT & private app usage.
A: The Application Risk Management Dashboard is a great starting point to uncover and monitor shadow IT. The dashboard helps you better understand:
- What risky & unmanaged apps are being used in your environment
- If there is any sensitive data movement to these risky & unmanaged apps
- If there are any unsanctioned or non-corporate app instances in use and the corresponding user activities
For private app usage, the Private Application Overview Dashboard in Netskope Library is a great option. The dashboard helps you better understand private app usage in your environment by providing visibility into private apps detected, user info, publisher usage, traffic volume, and policies triggered.
Q: How to detect performance issues like slowness in loading a Google doc?
A: Digital Experience Management (DEM) will be the best solution here. DEM leverages SkopeAI-powered analytics to diagnose, predict and prioritize events impacting user experience, application performance and availability. Learn more about Netskope One DEM.
Q: Dashboards to quickly detect threats warranting a deeper threat hunt.
A: We recommend starting with the CISO Dashboard in Netskope Library. This is a very high-level dashboard that helps you quickly identify security concerns in your environment, including overall policy violations, threat alerts, DLP alerts, blocked traffic, & risky app usage. The period-over-period comparison allows you to easily monitor how these concerns are evolving month over month.
Resources Shared in the Session
Netskope Community - Advanced Analytics: https://community.netskope.com/p/advanced-analytics
Training Resources Post: https://community.netskope.com/dashboard-gallery-38/advanced-analytics-training-resources-5713?tid=5713&fid=38
Netskope AI Gateway: https://www.netskope.com/products/ai-gateway
Netskope AI Guardrails: https://www.netskope.com/products/ai-guardrails
Netskope MCP Server: https://www.netskope.com/security-defined/what-is-mcp
Endpoint DLP Monitoring Dashboard:
https://community.netskope.com/dashboard-gallery-38/endpoint-dlp-monitoring-dashboard-7989
Webmail SMTP DLP Dashboard:
https://community.netskope.com/dashboard-gallery-38/webmail-smtp-dlp-insights-7988
CASB Health Check Dashboard V2.7:
https://community.netskope.com/dashboard-gallery-38/casb-health-check-dashboard-6075
NG-SWG Health Check Dashboard V2.8:
https://community.netskope.com/dashboard-gallery-38/ng-swg-health-check-dashboard-6104
Copy Widgets: https://community.netskope.com/discussions-37/copy-widgets-from-existing-dashboards-to-your-own-dashboards-7655
User/Organization Unit Investigation Dashboard:
Application Risk Management Dashboard:
https://community.netskope.com/dashboard-gallery-38/application-risk-management-6132
Netskope One Digital Experience Management (DEM): https://www.netskope.com/products/digital-experience-management


