


Hello Folks,
Below you can find a recap of the discussion “Harnessing AI Usage Using Advanced Analytics” in May Advanced Analytics office hours. Feel free to comment and continue the discussion, as well as attend our future sessions that can be found from the Community Events Calendar!
Q: I’d like to understand how my organization is adopting AI and continuously monitor the overall AI risk in our environment; key metrics include AI app usage, user activities, instance awareness, and policy effectiveness.
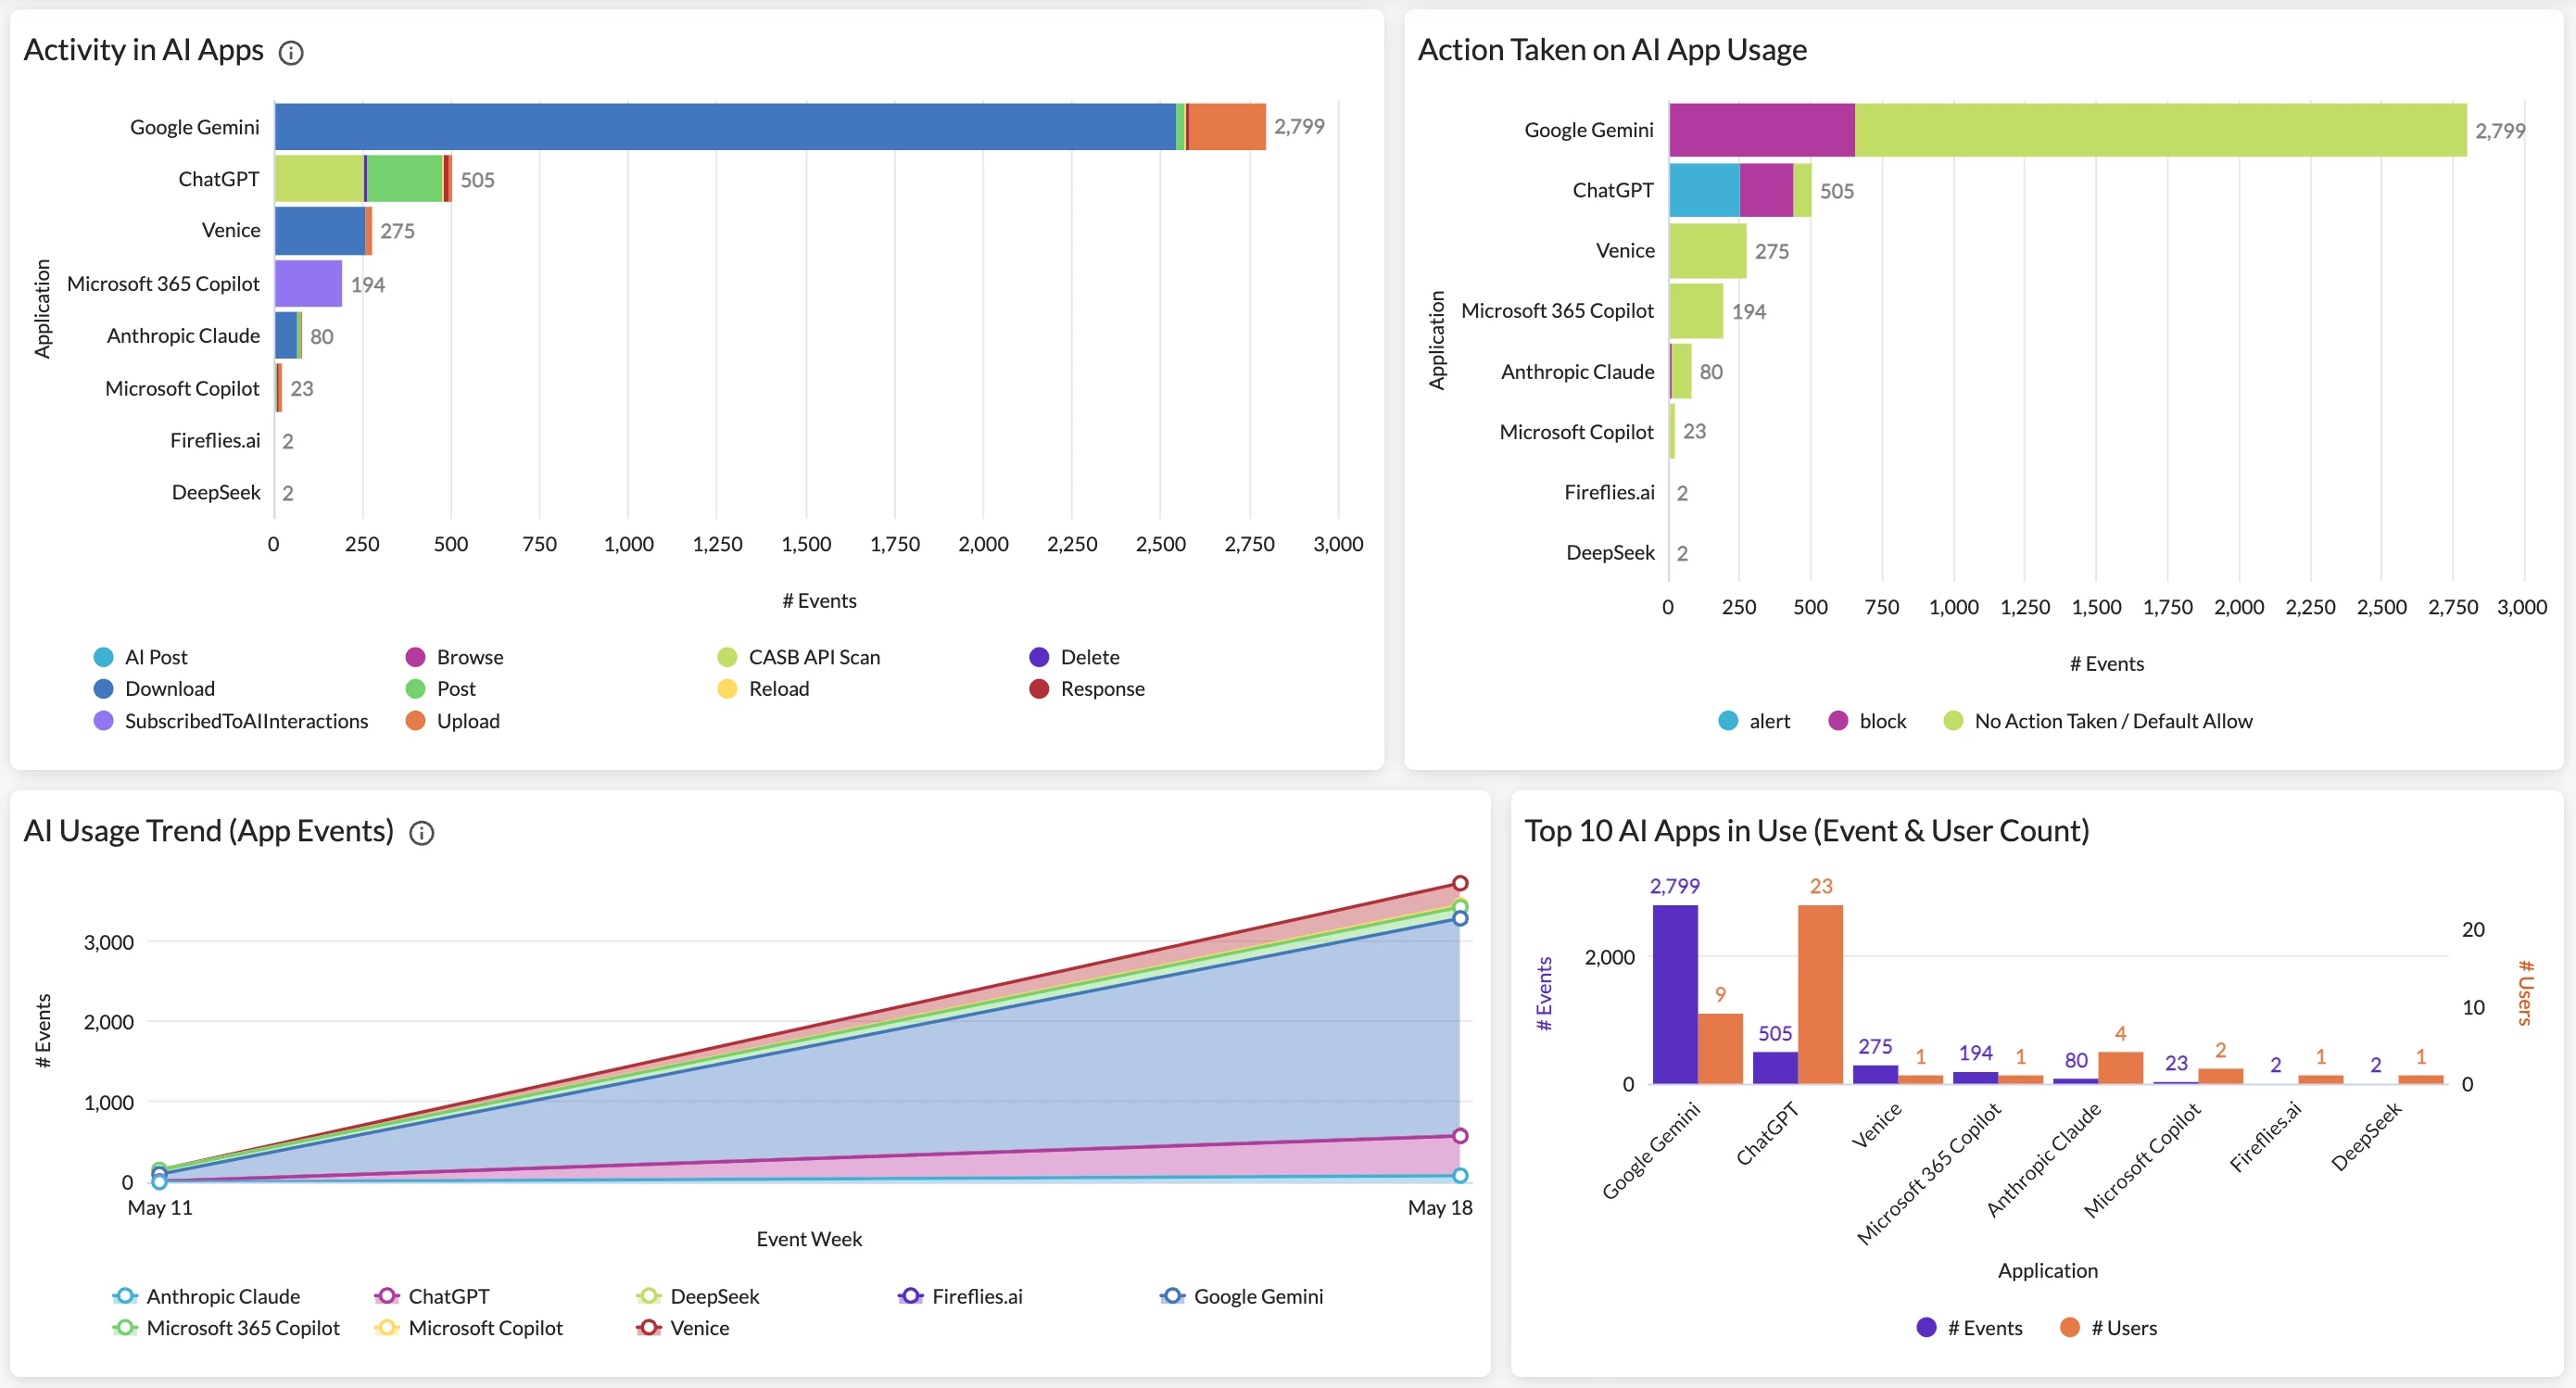
A: To monitor the overall AI adoption and uncover suspicious user activities, the AI Usage Dashboard in Netskope Library is a great starting point. The dashboard provides comprehensive visibility into AI app usage and site visits in your environment. Key metrics include AI app overview & usage trend, detailed user activities, instance awareness, policy actions, and web traffic generated in AI sites.
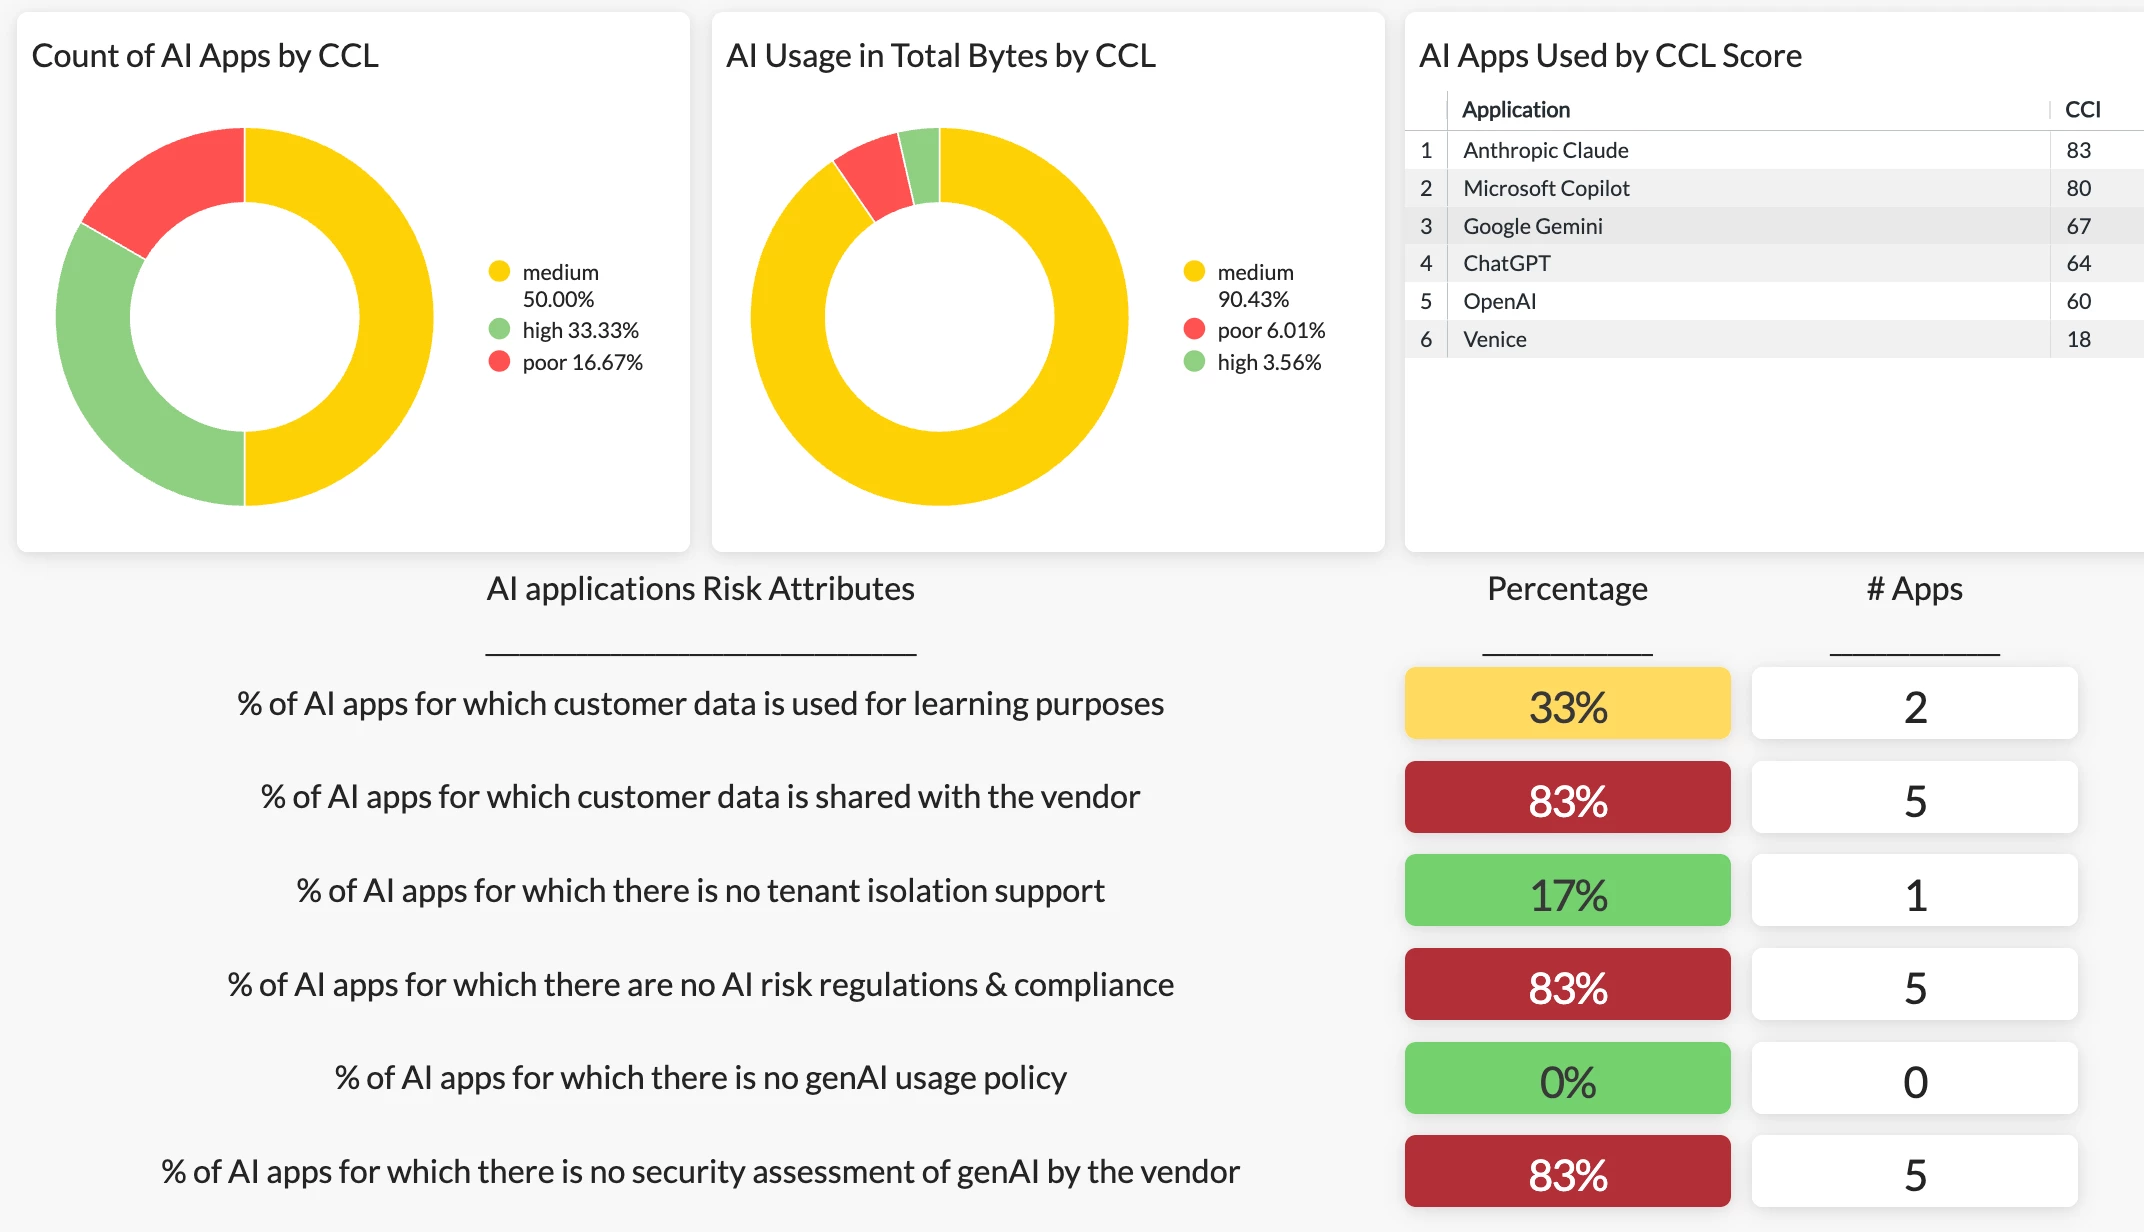
To gauge overall AI risk in your environment, the AI Risk Assessment Dashboard in Netskope Library is a great option. This dashboard helps you understand how “risky” your AI usage is based on our AI application risk attributes.
Q: I’m looking to drill into AI usage and uncover security concerns, especially risky/sensitive content exposed to or delivered by AI models.
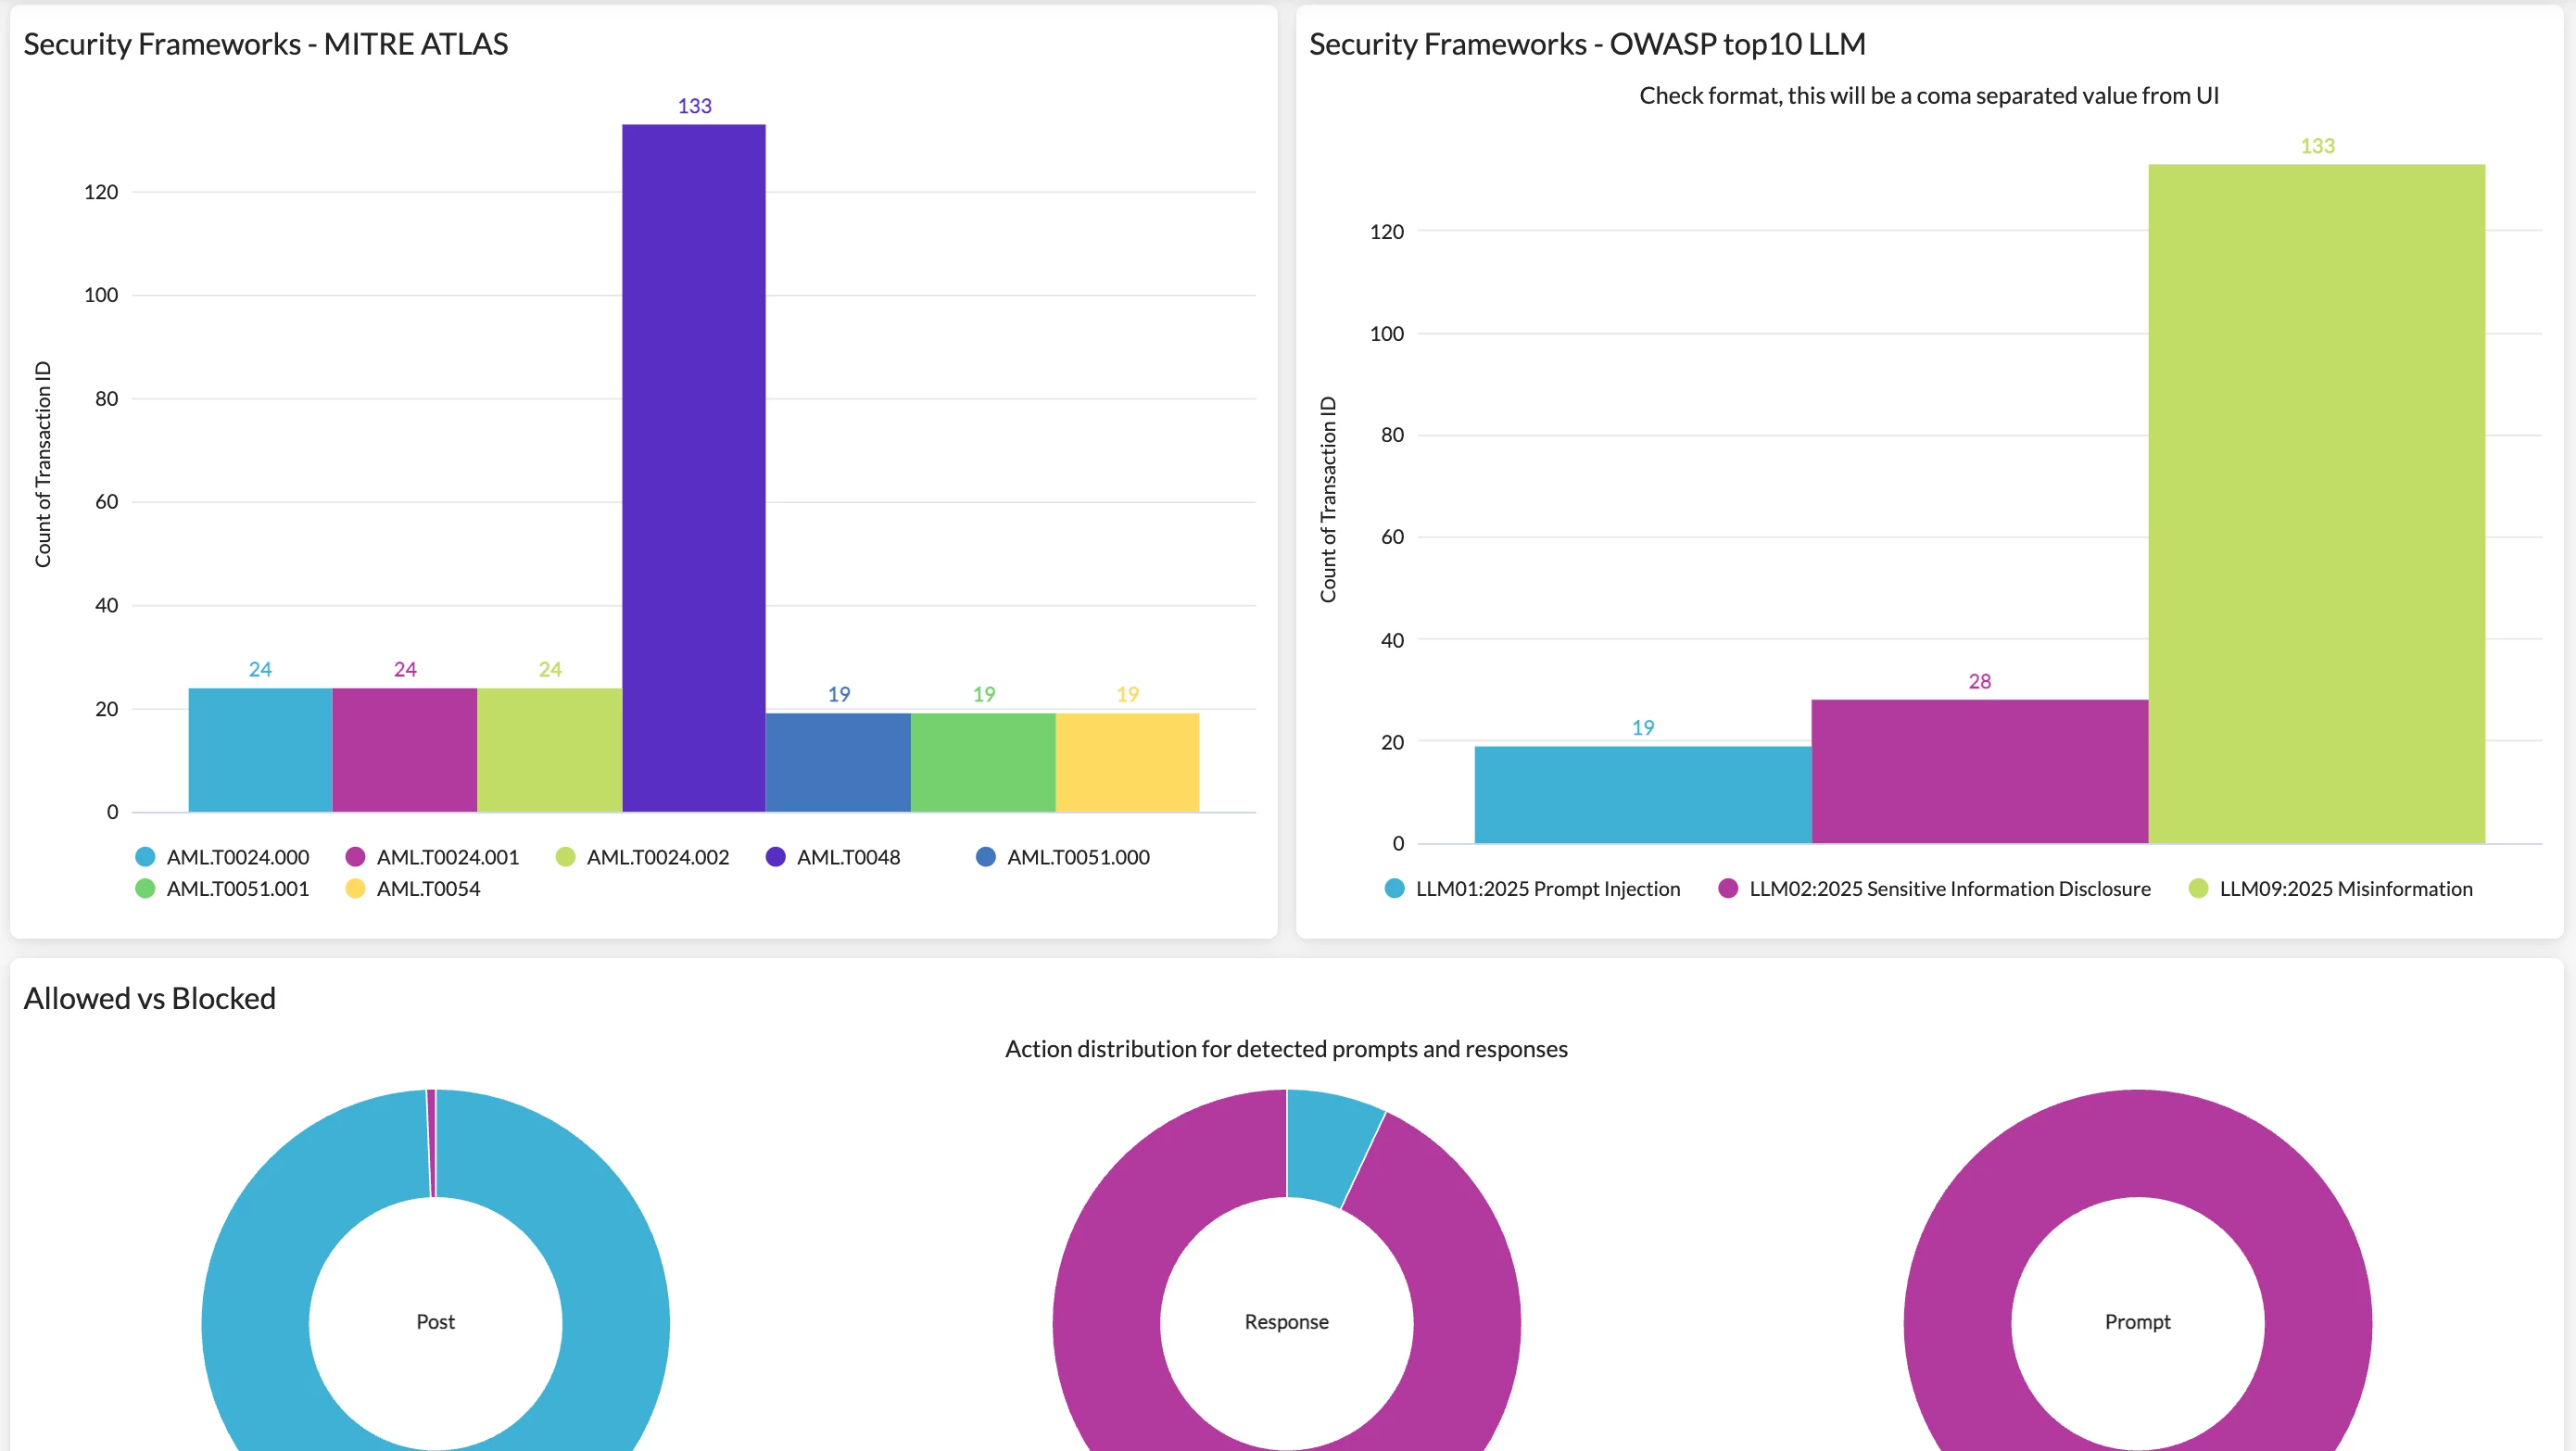
A: Our latest AI Guardrails Dashboard is a great starting point for this use case. The dashboard allows you to drill into the AI Guardrails alerts in your environment and identify risky behaviors like prompt injection, jailbreaks, unsafe use, and data leaks. It is the primary operational interface for you to:
- Monitor the volume and nature of AI interactions subject to guardrail policies
- Understand the balance of blocked versus monitored (allowed) traffic
- Identify high-risk content categories, matched keywords, and vulnerable applications
- Align findings to MITRE ATLAS techniques and OWASP LLM risks for SecOps workflows
- Investigate specific users or applications generating the most policy events
Q: How can I effectively monitor app-to-app traffic in AI usage? Key metrics I’m interested in include AI model usage, token consumption, API calls, & policy effectiveness.
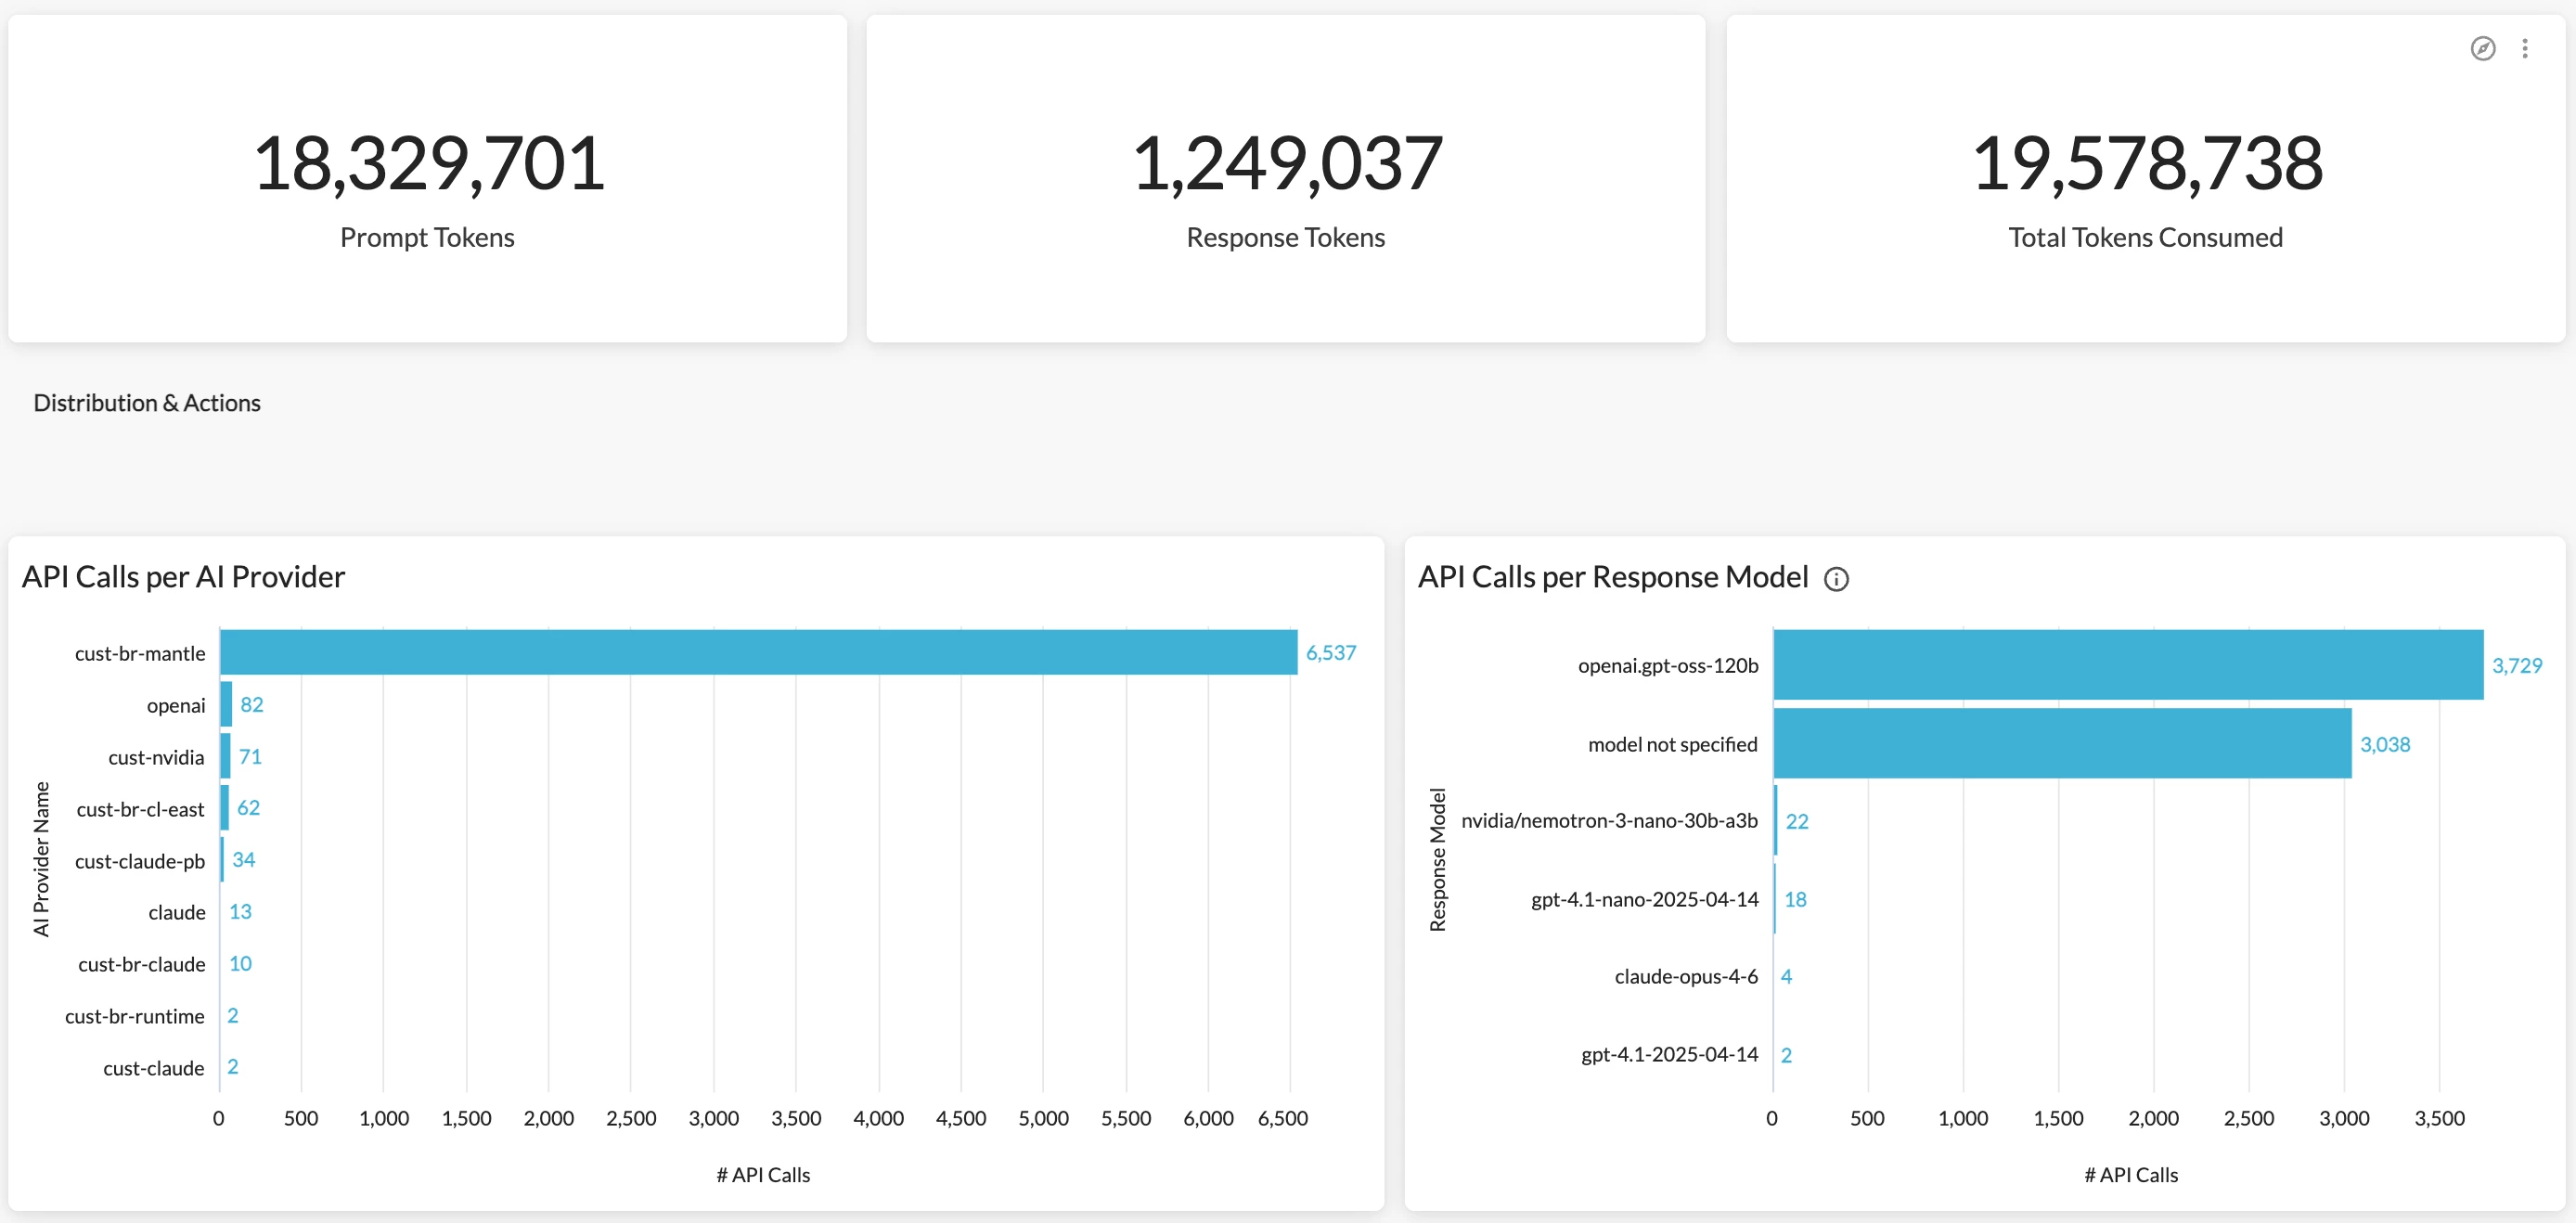
A: Another latest dashboard, AI Gateway Dashboard, is a great option for this use case. The dashboard allows you to investigate and continuously monitor the app-to-app traffic in AI usage with comprehensive visibility into API calls detected, token usage, policy actions, and gateway details. It is designed to serve several key personas across your organization:
- IT & Security Administrators — Monitor gateway health, policy enforcement, blocked requests, and rate-limiting behavior across all providers.
- Platform / AI Operations Teams — Track model usage, measure prompt and response token consumption, and identify anomalous API activity.
- Developers & Data Scientists — Analyze request patterns, HTTP error distributions, and model-level call volumes to troubleshoot integrations.
- Finance & Procurement Teams — Understand AI provider usage volume as a foundation for cost allocation and capacity planning.
Q: We have deployed Netskope One Agentic Broker in our environment. What’s the best way to monitor MCP usage in my organization?
A: Our upcoming Agentic Broker - MCP Dashboard will be a great choice for this use case. The dashboard will provide rich visibility into MCP usage in your environment, including MCP server access, MCP client usage, and MCP tool invocation. Stay tuned, the dashboard will be deployed very soon.


