


Hello Folks,
Below you can find a recap of the topics discussed during the September Advanced Analytics office hours and those sent in that we were not able to cover in the session. Feel free to comment and continue the discussion, as well as attend our future sessions that can be found from the Community Events Calendar!
Q: Is there a dashboard that can be used to monitor data movement?
A: For sure! Our latest Data Flow Investigation Dashboard V2 is a great option. The dashboard provides both high-level and granular visibility into the data movement in your environment from 3 dimensions: geolocation data flow (web transaction), cloud application data flow (app events), and endpoint data flow (endpoint traffic).
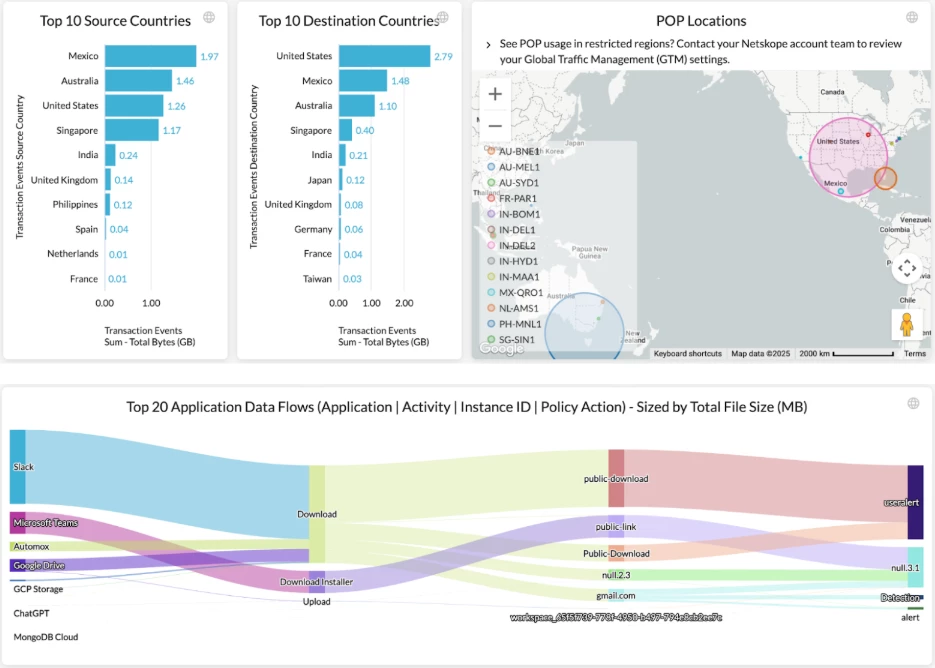
Together with this, we also provide a supplemental Control & Monitor Dashboard that helps you monitor sensitive data movement in your environment and better understand how Netskope DLP is controlling the sensitive data movement.
Q: Is it possible to compare the number of users in a predefined category vs. internal custom connector in a single visual?
A: Yes. Let’s take Gemini as an example. There are two different versions of Gemini being used within Netskope, the original Google Gemini and a customized “Netskope version” Google Gemini. We can use "Instance ID” to distinguish between them.
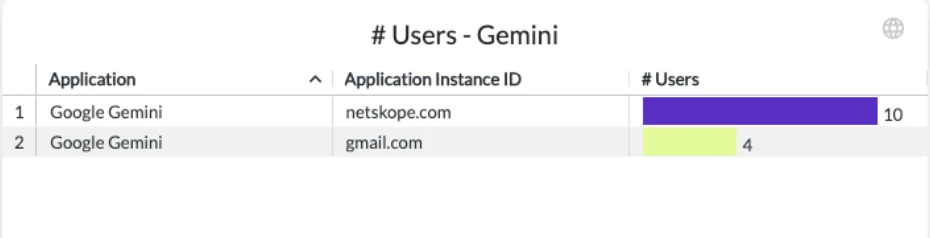
There are two options to create a trend chart that shows the number of users using these two different versions of Gemini.
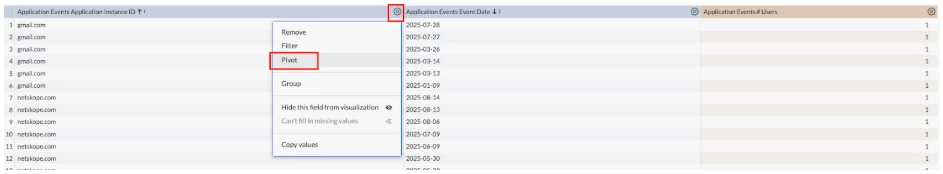
Option 1: Pivot
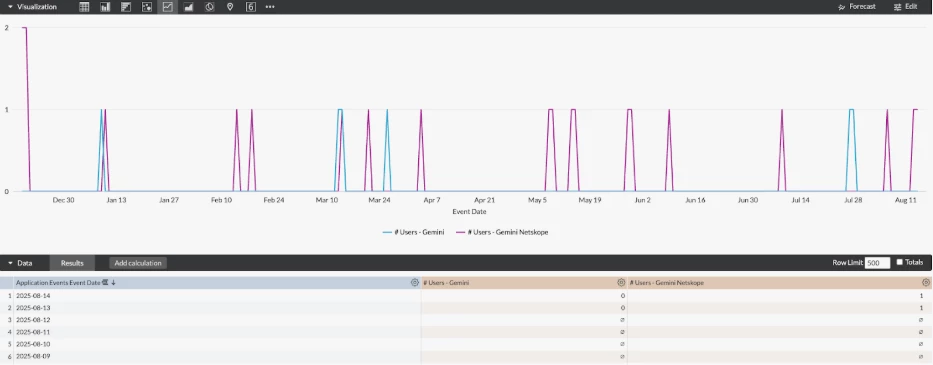
By adding “Instance ID,” “Event Date,” and “# Users” to the widget and pivoting the data by “Instance ID,” an aggregated trend chart will be created.
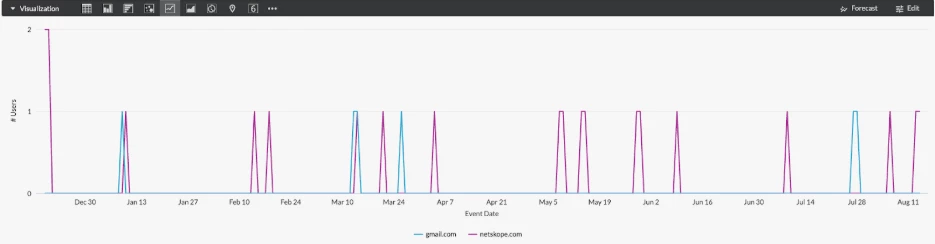
The chart contains two different trend lines, a blue line that reflects the number of users using the original Google Gemini (gmail.com) and a purple line that reflects the number of users using the customized “Netskope version” Google Gemini (netskope.com).
Option 2: Custom Measure
We can also create two custom measures based on “# Users,” one with the filter “Instance ID is gmail.com” and the other one with the filter “Instance ID is netskope.com.”
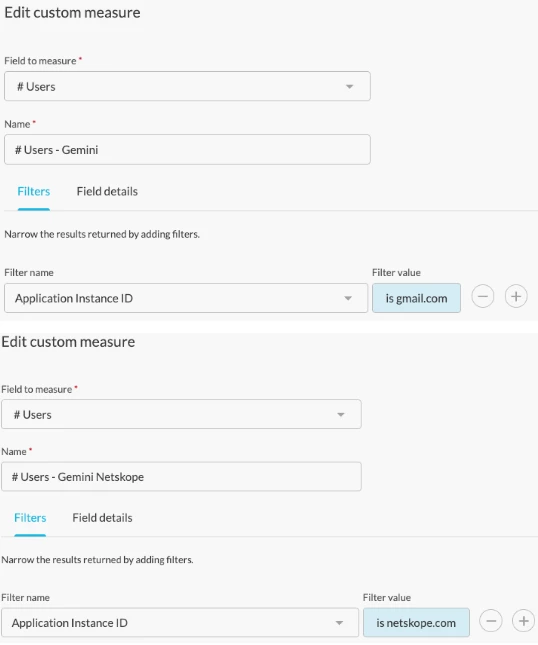
This will generate two different “# Users” columns in the data and two different trend lines in the visual.
For more details about custom measures, check this post.
Q: Why are some widgets failing to show data?
A: Typically, there are 4 types of widget errors in Advanced Analytics: incompatible data, incompatible visual type, query error, and server/platform error. This article will walk you through more details about these errors and how to resolve them.
Q: What are the key use cases Advanced Analytics can help us solve beyond standard dashboards? Visualize trends in shadow IT?
A: The Application Risk Management Dashboard is a great starting point to uncover and monitor shadow IT. The dashboard helps you better understand:
- What risky & unmanaged apps are being used in your environment
- If there is any sensitive data movement to these risky & unmanaged apps
- If there are any unsanctioned or non-corporate app instances in use and the corresponding user activities
Q: How do I create a query that uses 2 different data collections with “user” as a primary key?
A: Merge Query can help. Step by step instructions can be found in this case study.
Q: We’re looking to monitor email aliases/alternate emails used in our organization. Can Advanced Analytics help with this?
A: Of course! Check out our latest Webmail SMTP DLP Dashboard. This dashboard provides visibility into webmail traffic captured by Netskope SMTP Proxy and the corresponding DLP policy violations. Use this dashboard to better understand:
- What email aliases/alternate email addresses (From User) are being used by users in your organization
- What DLP policy violations have been triggered by the webmail traffic
- Who are the users generating this traffic and triggering the policy violations
- What actions have been taken by your DLP policies
Q: Which log info is important for detecting cyber attacks?
A: We recommend starting with the Alerts data collection since it provides direct visibility into cyber attacks such as malware, malicious sites, & phishing. The Threat Protection Dashboard in Netskope Library is a great starting point.
Q: Can Netskope manage browser extensions, including those in incognito?
A: Currently our reporting & analytics platform does not provide explicit visibility into browser extensions. If you need this type of data, please contact your Netskope account team to initiate a feature request.
Resources Shared in the Session
Netskope Community - Advanced Analytics: https://community.netskope.com/p/advanced-analytics
Training Resources Post: https://community.netskope.com/dashboard-gallery-38/advanced-analytics-training-resources-5713?tid=5713&fid=38
CASB Health Check Dashboard V2.7:
https://community.netskope.com/dashboard-gallery-38/casb-health-check-dashboard-6075
NG-SWG Health Check Dashboard V2.8:
https://community.netskope.com/dashboard-gallery-38/ng-swg-health-check-dashboard-6104
Data Flow Investigation Dashboard V2:
https://community.netskope.com/dashboard-gallery-38/data-flow-investigation-dashboard-v2-7986
Data Flow Investigation Dashboard V2 - Control & Monitor:
Custom Fields - Sample Use Cases:
https://community.netskope.com/dashboard-gallery-38/custom-fields-sample-use-cases-7941
Application Risk Management Dashboard:
https://community.netskope.com/dashboard-gallery-38/application-risk-management-6132
Application Instance Overview Dashboard:
China Traffic Insights:
https://community.netskope.com/dashboard-gallery-38/china-traffic-insights-6956
Merge Query:
https://www.youtube.com/watch?v=wj2bQHHDdJw
Webmail SMTP DLP Dashboard:
https://community.netskope.com/dashboard-gallery-38/webmail-smtp-dlp-insights-7988


