


Hello Folks,
Below you can find a recap of the topics discussed during the September Advanced Analytics office hours and those sent in that we were not able to cover in the session. Feel free to comment and continue the discussion, as well as attend our future sessions that can be found from the Community Events Calendar!
Q: Are there any recommended dashboards for security operations monitoring?
A: There are 3 different “health check” dashboards in our community. All of them are great starting points for you to monitor security operations.
The purpose of this dashboard is to help you maximize the ROI of your Netskope investment and to ensure you are using Netskope products to their full potential. With a focus on CASB, the dashboard covers multiple topics such as NewEdge Network, Traffic Steering, SSL Inspection, Application Risk Management, Malware Protection, and DLP, which answers the question “how Netskope is protecting your environment.” Recommendations / call to actions / best practices are provided in each section, which helps you better understand how to mitigate the security concerns identified & enhance your security posture correspondingly.
A typical use case with this dashboard is “to highlight change and demonstrate value.” For example, if you enhanced your threat protection by tuning your malware block policies and now want to see if the policies were working effectively in the past few months, the Inline Malware Blocks section of this dashboard will be a great option. It shows how the “blocked malware count” was changing over time, which highlights the value of the enhancement you have made to threat protection.

This dashboard shares the same purpose and use cases with the CASB Health Check Dashboard above, but focuses on NG-SWG.
Security Health Check (Self-Service) Dashboard
This is an all-in-one dashboard which allows you to perform self-service health checks and to identify security concerns / issues in your environment. The dashboard answers 2 questions: 1) How Netskope is protecting your environment; 2) What Netskope is protecting your environment from.
Compared to the previous CASB and NG-SWG Health Check Dashboards that focus on showcasing business values, this dashboard focuses on quickly locating security concerns / issues in your environment.
More topics such as Device & Client Management, Alerts, and Policies are covered in this dashboard, which provides a high-level overview of your entire environment.

“User investigation” tables are also included, which helps you source all the risky traffic in your environment.
A typical use case with this dashboard is “threat hunting / troubleshooting.” If you observe some unexpected / anomalous data (e.g. an extremely high number of DLP alerts triggered in the past 7 days) and want to understand why this is happening, this dashboard is a great option. You can also leverage this dashboard to perform regular health checks to your environment.
Q: How does Advanced Analytics help monitor AI usage?
A: The AI Usage Dashboard in Netskope Library allows you to monitor AI usage from the big picture. The data provided helps you identify trends/patterns of AI usage such as AI app usage trend, user group breakdown, activity summary, instance awareness, and policy action.
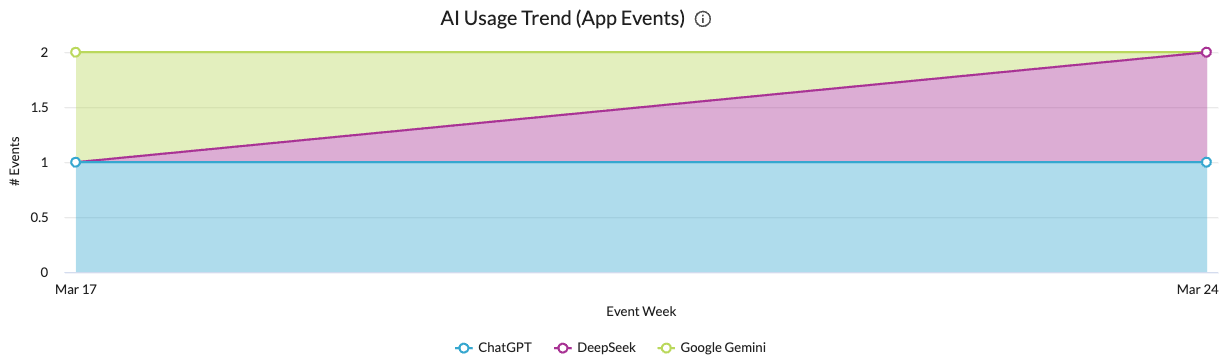
Another great dashboard is the DeepSeek Usage Dashboard that provides detailed visibility into how DeepSeek is being used in your environment. The dashboard helps you identify suspicious/risky user activities such as sensitive data movement, unexpected justification reasons, and anomalous web transactions.

Of course, based on your use cases, you can update this dashboard with a focus on any other AI apps. The only thing you need to do is change the “Application” filter on top of the dashboard.

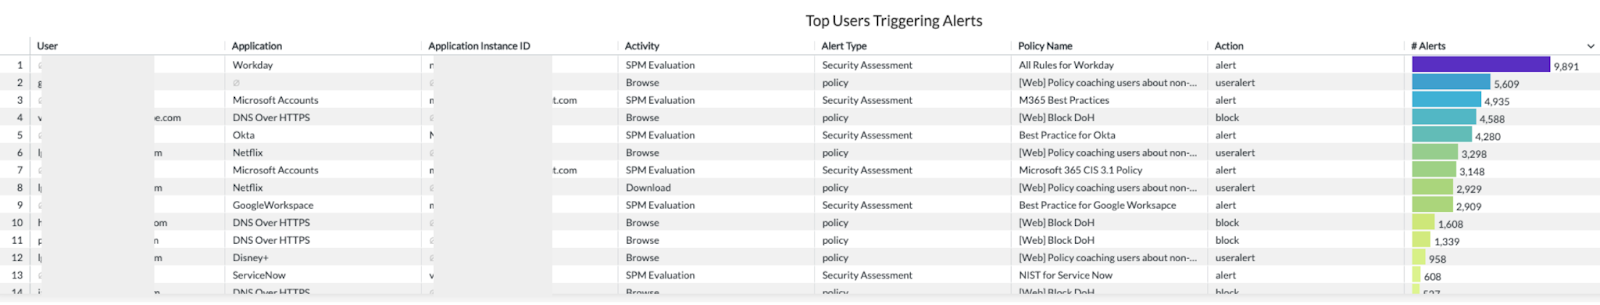
Q: What are the recommended dashboards that can be used to monitor risky user behaviors?
A: The User Behavior Analytics (UBA) Dashboard is a good starting point. The dashboard helps you monitor anomalous user behaviors in your environment by providing high-level overviews of the UBA alerts triggered and detailed visibility into each type of UBA alerts.
If you are looking to drill into user activities, the User/Organization Unit Investigation Dashboard in our community will be a great option. This dashboard provides both high-level and detailed visibility into user activities, which helps you identify and monitor suspicious/risky user activities, e.g. PCI files uploaded through non-corporate instances, in your environment.
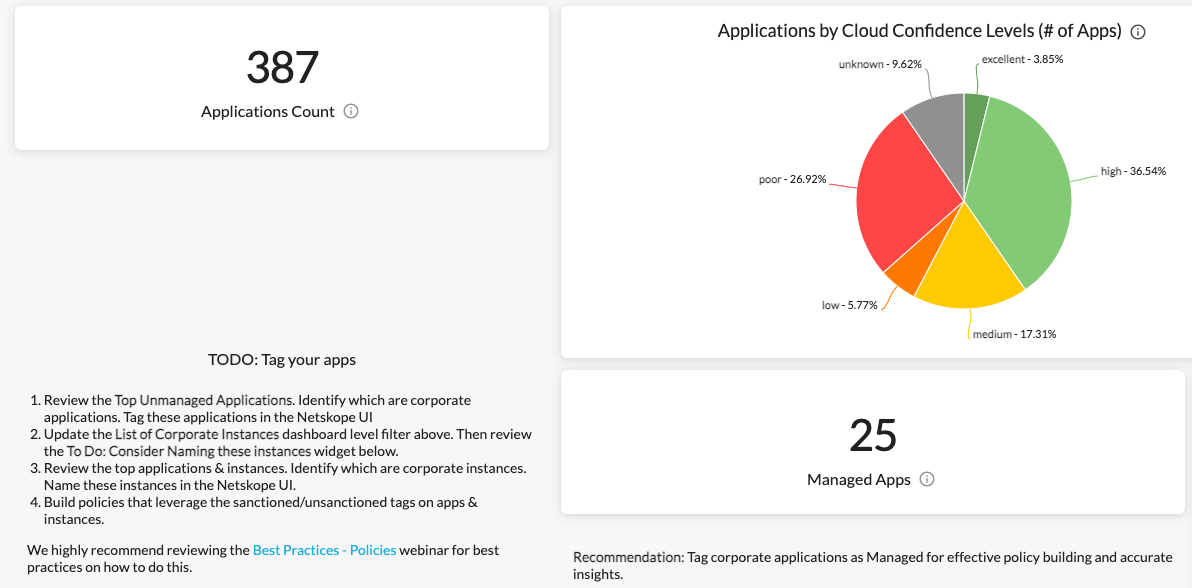
Q: How to use Advanced Analytics to protect our organization from Shadow IT?
A: The Application Risk Management Dashboard is a great starting point to uncover risky app usage. The dashboard helps you better understand:
- What risky & unmanaged apps are being used in your environment
- If there is any sensitive data movement to these risky & unmanaged apps
- If there are any non-corporate app instances in use and the corresponding user activities
Q: How to use custom fields to address advanced use cases?
A: There are 3 types of custom fields in Advanced Analytics: Custom Dimension, Custom Measure, & Table Calculation. Based on the real-world scenarios, this post in our community showcases how to best use custom fields to address advanced use cases with step by step instructions. Take a look!
Q: What training documentation is accessible for us to develop foundational knowledge to execute Netskope for security posture?
A: There are 3 recommended resources:
This is the primary starting point for you to develop foundational knowledge of Netskope products and learn about best practices.
Netskope Academy / Training Discussions
This is the place for you to level up your Netskope product knowledge, view the latest training resources, connect with your peers, and provide feedback.
This is the place for you to understand how Netskope is leveraging Netskope products to address Netskope’s own use cases.
Q: Does Advanced Analytics provide visibility into web traffic or bandwidth usage in our organization?
A: Yes, our latest Bandwidth Consumption Dashboard can help you monitor bandwidth usage in your environment based on 3 trending use cases:
- Uncover malicious/suspicious sites with high bandwidth usage
- Monitor bandwidth usage by geolocation; avoid overusing your license in particular regions
- Monitor bandwidth usage by office locations; consider upgrading/adding internet circuits
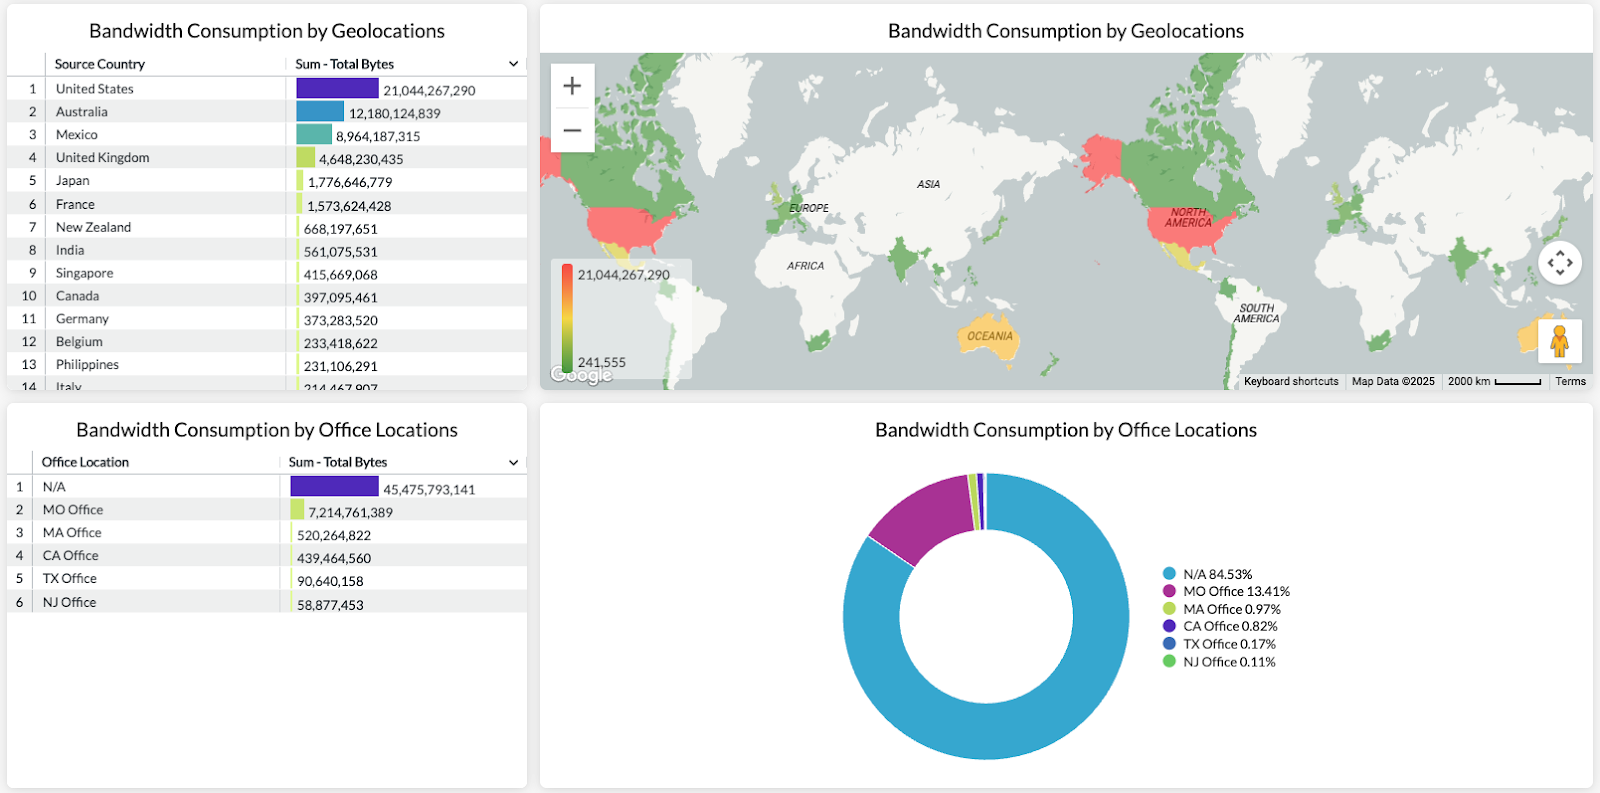
Looking to better investigate bandwidth issues? Digital Experience Management (DEM) can help. Learn more about Netskope One DEM.
Resource shared in the session:
Netskope Community - Advanced Analytics: https://community.netskope.com/p/advanced-analytics
Training Resources Post: https://community.netskope.com/dashboard-gallery-38/advanced-analytics-training-resources-5713?tid=5713&fid=38
Copy Existing Widgets:
AI Usage Dashboard Demo:
DeepSeek Usage Dashboard:
https://community.netskope.com/dashboard-gallery-38/deepseek-usage-dashboard-7385
User/Organization Unit Investigation Dashboard:
Application Risk Management Dashboard:
https://community.netskope.com/dashboard-gallery-38/application-risk-management-6132
Application Instance Overview Dashboard:
CASB Health Check Dashboard V2.7:
https://community.netskope.com/dashboard-gallery-38/casb-health-check-dashboard-6075
NG-SWG Health Check Dashboard V2.8:
https://community.netskope.com/dashboard-gallery-38/ng-swg-health-check-dashboard-6104
Netskope Learning Path:
https://community.netskope.com/p/netskopecustomerworkshops
Netskope Academy / Training Discussions:
https://community.netskope.com/netskope-academy-training-discussions-19
Inside Netskope: https://community.netskope.com/inside-netskope-22


