


Hello Folks,
Below you can find a recap of the topics discussed during the September Advanced Analytics office hours and those sent in that we were not able to cover in the session. Feel free to comment and continue the discussion, as well as attend our future sessions that can be found from the Community Events Calendar!
Secure Client Enrollment (Rogue Device) Dashboard
By providing visibility into users with multiple devices & device classifications, this dashboard helps you identify “rogue devices” in your environment. For more details about how to best use the dashboard, please view this video.
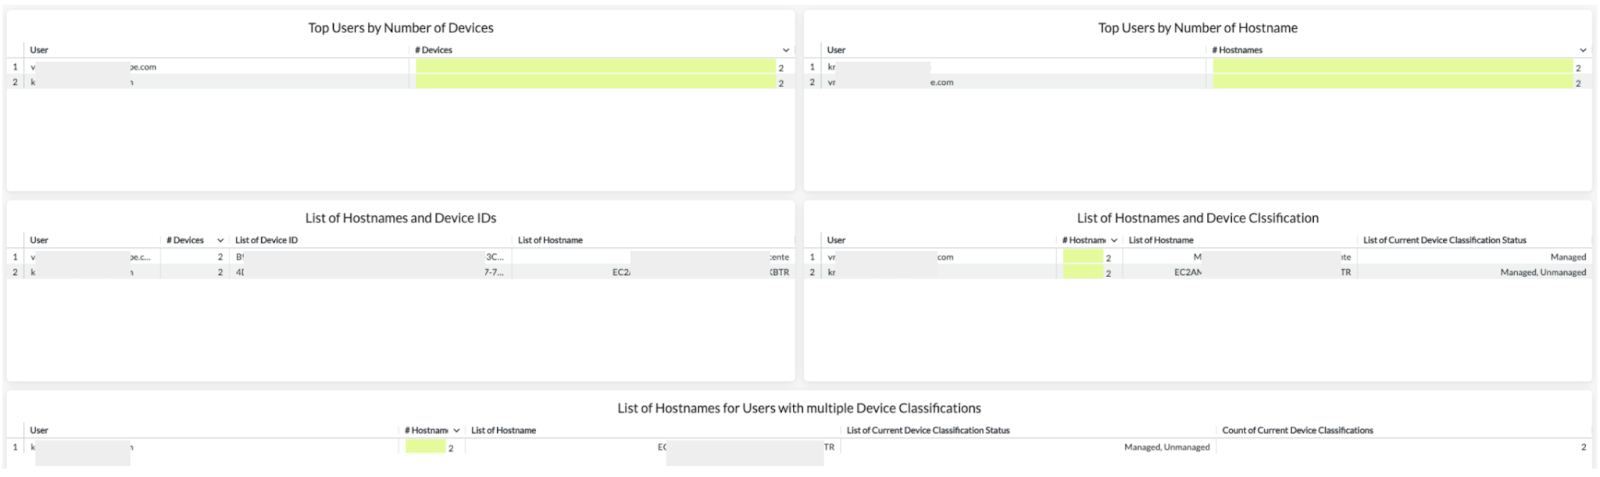
The dashboard can be found here.
Admin Disabled User Dashboard
Based on the Device Data, this dashboard allows you to identify “admin disabled” users who have not yet been re-enabled. Detailed instructions about how to best use the dashboard are provided.
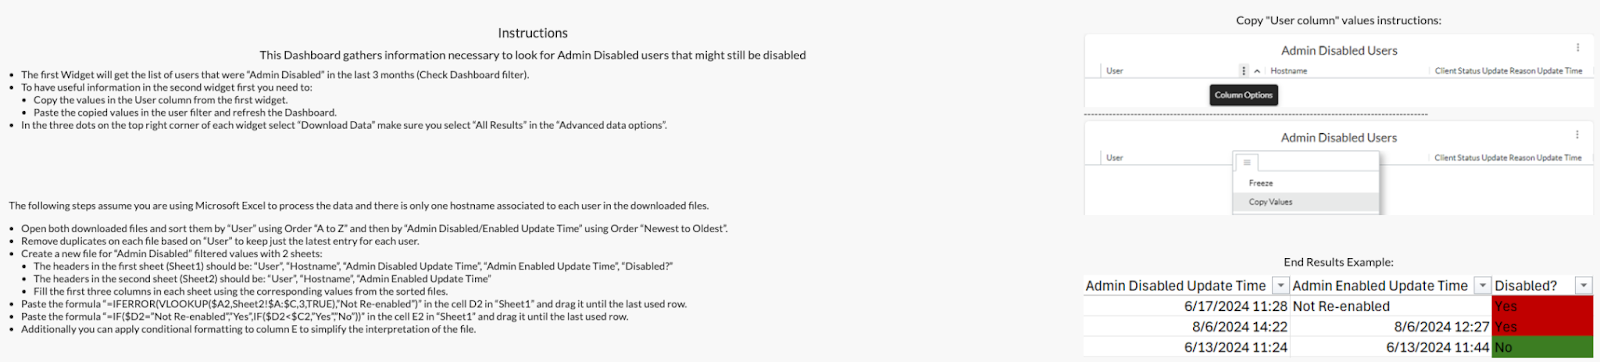
The dashboard can be found here.
POP Usage Dashboard
Based on Application Events, this dashboard provides visibility into Netskope Host POP’s detected in your environment and users connected to each of them. Use this dashboard to better understand how Netskope POP’s are being used by your organization.
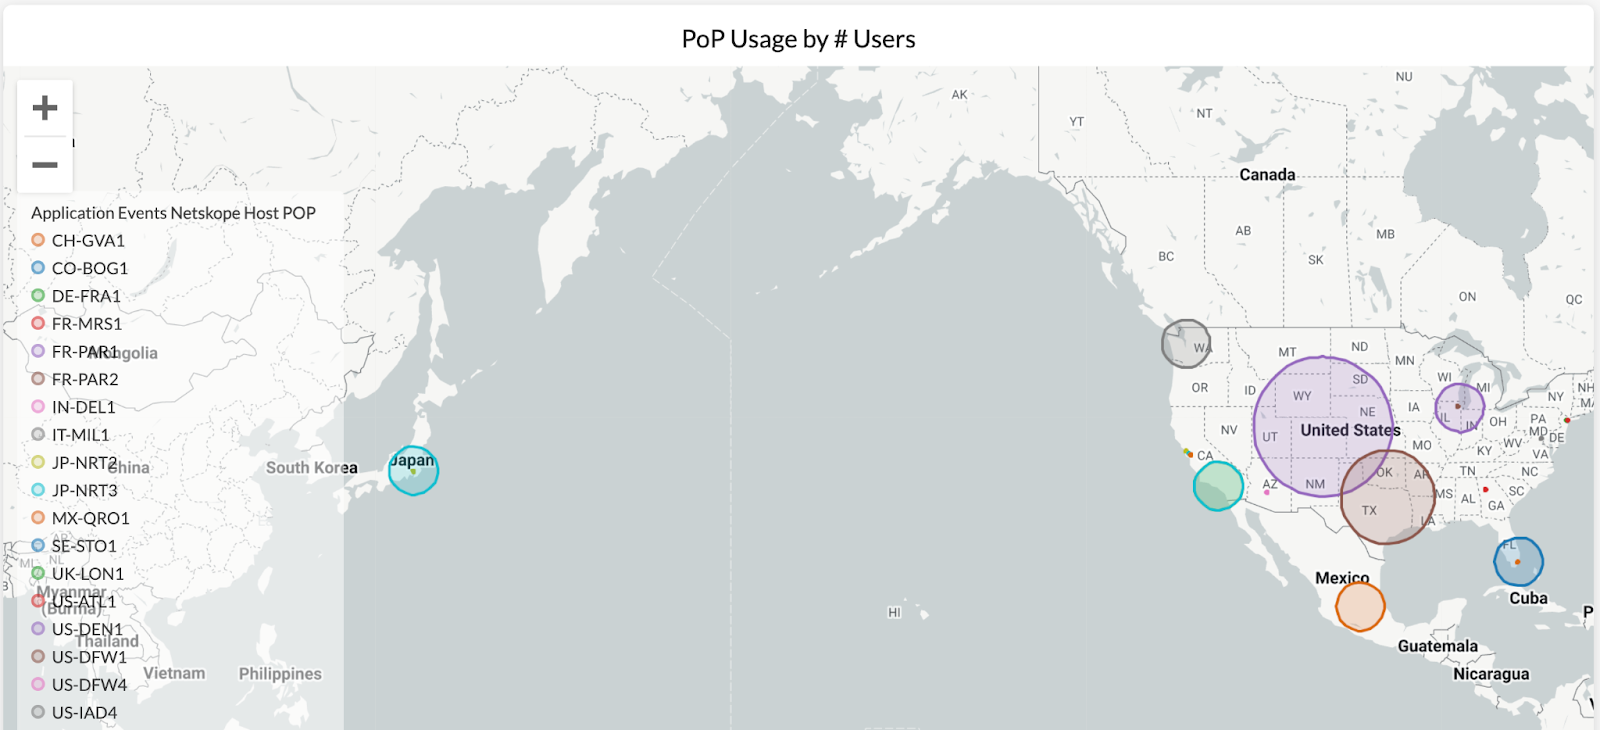
The dashboard can be found here.
Data Consumption (China Traffic) Dashboard
Based on Transaction Events, this dashboard provides visibility into data consumption volumes in China, which helps you optimize your steering & security policies. More specifically, you will be able to identify the top users & sites responsible for consuming the greatest amount of data transferred in China. This is also a directional dashboard which helps you understand if you are approaching/exceeding the data limits for China POP’s.
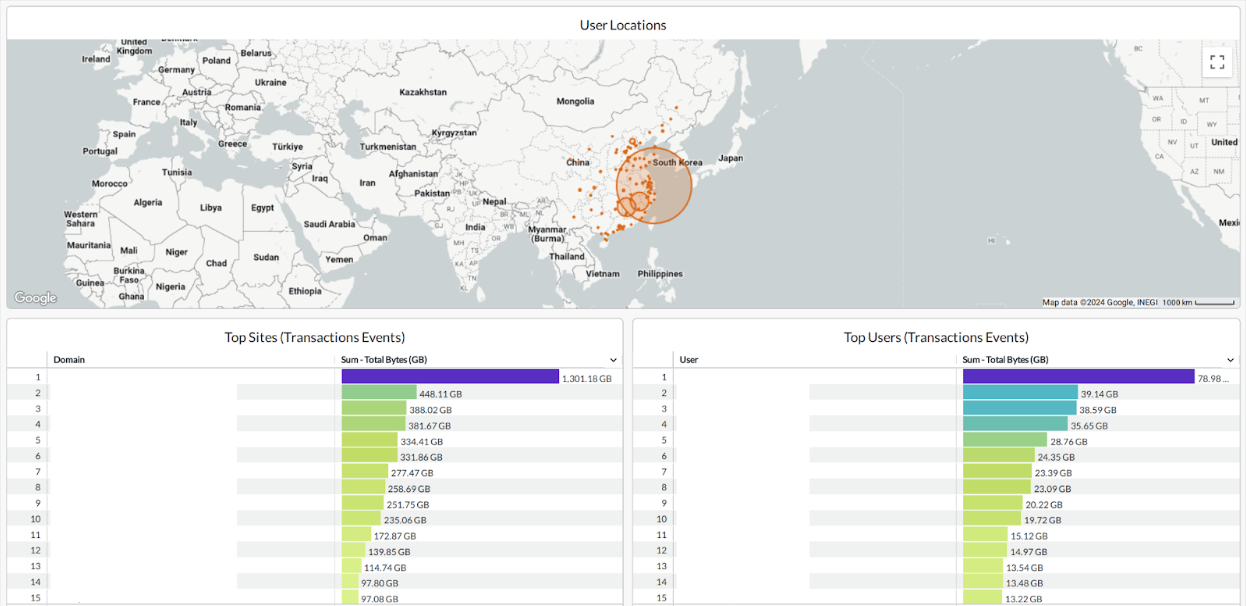
The dashboard can be found here.
Advanced UEBA Dashboard
This dashboard provides detailed visibility into the alerts generated by Advanced UEBA (ML-based) policies, which helps you perform user investigation & alert validation on this topic. With the dashboard, you can better understand why these alerts are being triggered and if your policies are working effectively.
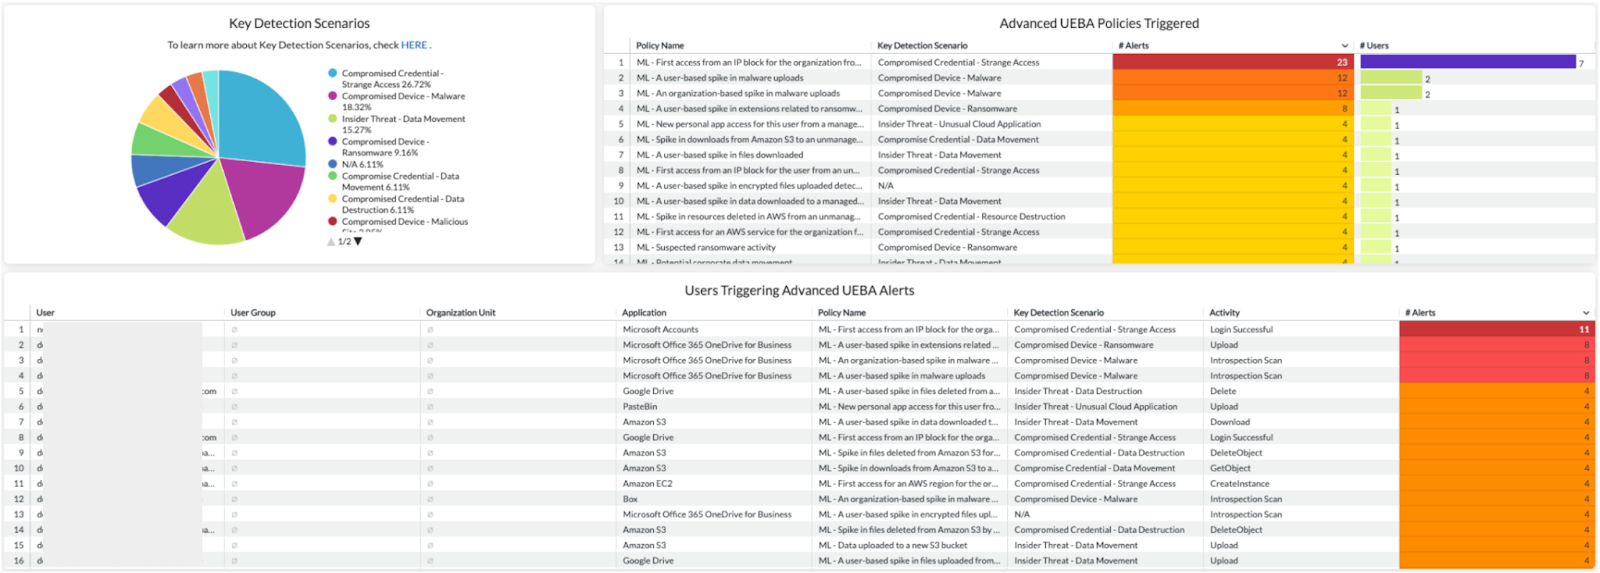
The dashboard can be found here.
Disabled Client Dashboard
Users/devices with clients disabled can be security concerns to your environment. By focusing on disabled clients, this dashboard helps you better understand who are the users disabling their clients, why are the clients disabled, and how long have the clients been disabled.
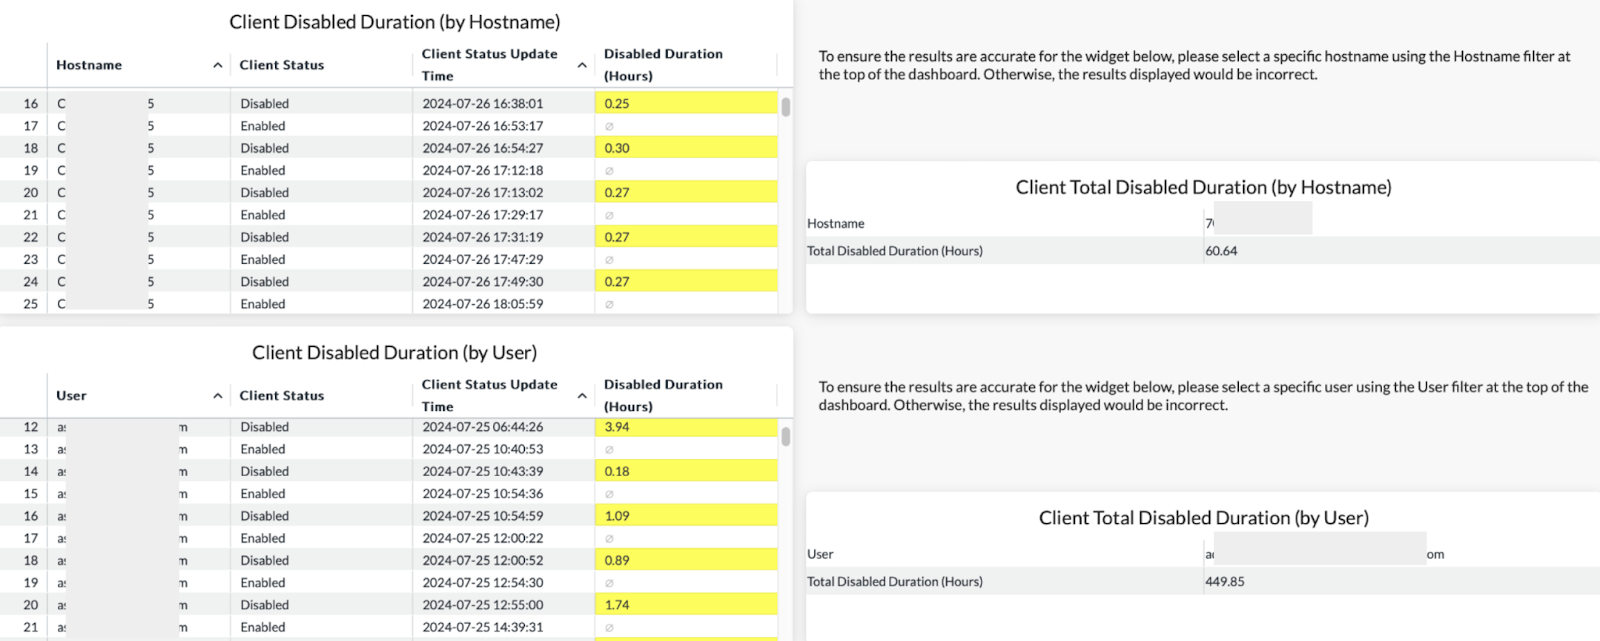
The dashboard can be found here.
SSL Decryption
SSL decryption policies are applied right after traffic is steered to Netskope. By default, all traffic steered to Netskope will be decrypted, then further analyzed via Real-time Protection policies. If there is any traffic that you would like to leave encrypted, e.g. PII data, you can specify them in a SSL Decryption policy. For more details about adding a SSL Decryption policy, please view this blog.
Advanced Analytics provides visibility into SSL inspection. The SSL Inspection Dashboard can help you better understand how much traffic in your environment is being inspected and bypassed. Use this dashboard to assess how well SSL inspection is being operationalized by your organization.
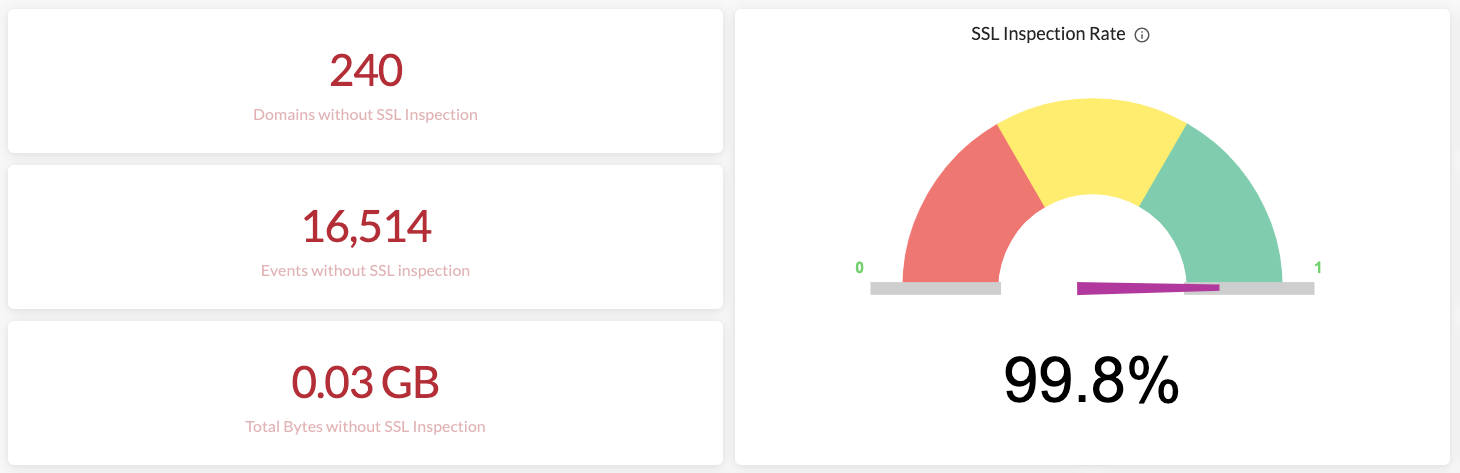
The dashboard is available in Netskope Library.
Links shared in the session:
Netskope Community - Advanced Analytics: https://community.netskope.com/p/advanced-analytics
Client Secure Enrollment - “Rogue Device” Dashboard: https://community.netskope.com/dashboard-gallery-38/nskpsa-2024-001-dashboard-6960
“Admin Disabled User” Dashboard: https://community.netskope.com/dashboard-gallery-38/use-aa-to-help-to-find-admin-disabled-users-that-were-not-re-enabled-6997
Training Resources Post: https://community.netskope.com/dashboard-gallery-38/advanced-analytics-training-resources-5713?tid=5713&fid=38
Advanced UEBA Dashboard:
https://community.netskope.com/dashboard-gallery-38/advanced-ueba-dashboard-6944
Disabled Client Dashboard:
https://community.netskope.com/dashboard-gallery-38/disabled-client-dashboard-6914
POP Usage Dashboard: https://community.netskope.com/dashboard-gallery-38/netskope-host-pop-usage-5731
Data Consumption (China Traffic) Insights Dashboard:
https://community.netskope.com/dashboard-gallery-38/china-traffic-insights-6956
CASB Health Check Dashboard:
NG-SWG Health Check Dashboard:
https://community.netskope.com/dashboard-gallery-38/updated-ng-swg-health-check-dashboard-6104
Security Health Check (Self-Service) Dashboard:
SSL Decryption:
https://docs.netskope.com/en/ssl-decryption/#ssl-decryption-1
Add Policies for SSL Decryption: https://docs.netskope.com/en/add-a-policy-for-ssl-decryption/#add-a-policy-for-ssl-decryption-1


