


Hello Folks,
Below you can find a recap of the topics discussed during the September Advanced Analytics office hours and those sent in that we were not able to cover in the session. Feel free to comment and continue the discussion, as well as attend our future sessions that can be found from the Community Events Calendar!
Q: Are there any best practices or recommended dashboards for Advanced Analytics?
A: When using Advanced Analytics, you don’t have to create everything from scratch. Our predefined dashboards provide rich visibility into a broad range of topics. There are 3 different “health check” dashboards in our community. All of them are great starting points for you to explore your environment.
The purpose of this dashboard is to help you maximize the ROI of your Netskope investment and to ensure you are using Netskope products to their full potential. With a focus on CASB, the dashboard covers multiple topics such as NewEdge Network, Traffic Steering, SSL Inspection, Application Risk Management, Malware Protection, and DLP, which answers the question “how Netskope is protecting your environment.” Recommendations / call to actions / best practices are provided in each section, which helps you better understand how to mitigate the security concerns identified & enhance your security posture correspondingly.
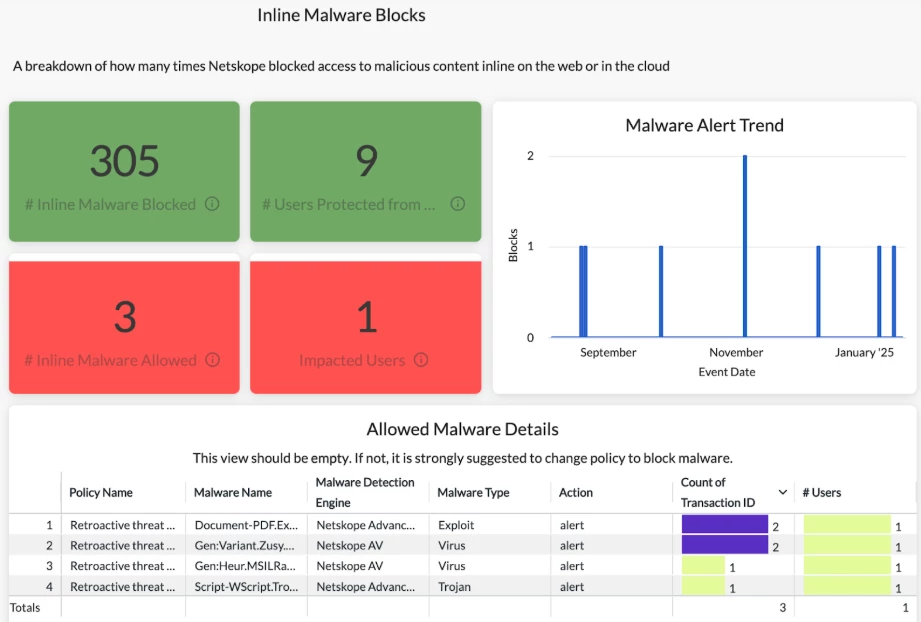
A typical use case with this dashboard is “to highlight change and demonstrate value.” For example, if you enhanced your threat protection by tuning your malware block policies and now want to see if the policies were working effectively in the past few months, the Inline Malware Blocks section of this dashboard will be a great option. It shows how the “blocked malware count” was changing over time, which highlights the value of the enhancement you have made to threat protection.
This dashboard shares the same purpose and use cases with the CASB Health Check Dashboard above, but focuses on NG-SWG.
Security Health Check (Self-Service) Dashboard
This is an all-in-one dashboard which allows you to perform self-service health checks and to identify security concerns / issues in your environment. The dashboard answers 2 questions: 1) How Netskope is protecting your environment; 2) What Netskope is protecting your environment from.
Compared to the previous CASB and NG-SWG Health Check Dashboards that focus on showcasing business values, this dashboard focuses on quickly locating security concerns / issues in your environment.
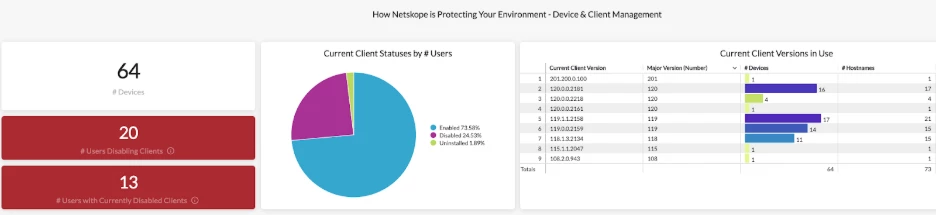
More topics such as Device & Client Management, Alerts, and Policies are covered in this dashboard, which provides a high-level overview of your entire environment.
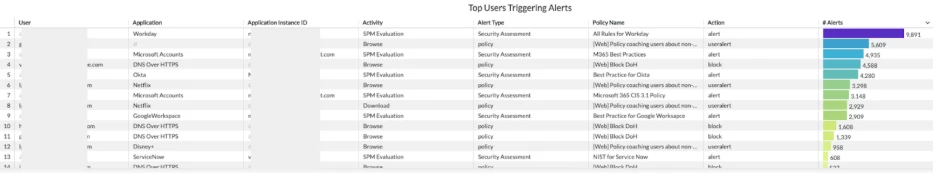
“User investigation” tables are also included, which helps you source all the risky traffic in your environment.
A typical use case with this dashboard is “threat hunting / troubleshooting.” If you observe some unexpected / anomalous data (e.g. an extremely high number of DLP alerts triggered in the past 7 days) and want to understand why this is happening, this dashboard is a great option. You can also leverage this dashboard to perform regular health checks to your environment.
For Advanced Analytics best practices, please check this article.
Q: We’re looking to monitor & investigate shadow IT usage in our environment. Are there any recommended dashboards?
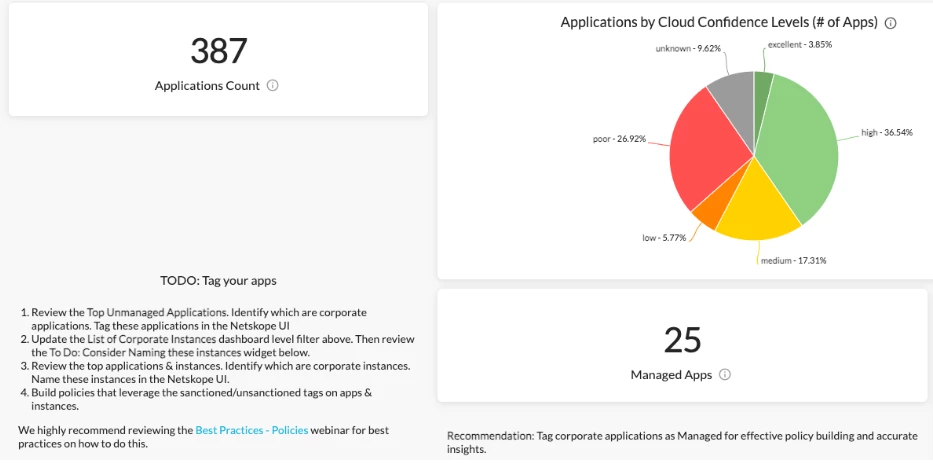
A: The Application Risk Management Dashboard is a great starting point to uncover and monitor shadow IT. The dashboard helps you better understand:
- What risky & unmanaged apps are being used in your environment
- If there is any sensitive data movement to these risky & unmanaged apps
- If there are any unsanctioned or non-corporate app instances in use and the corresponding user activities
Q: How can I merge data from two different data collections?
A: Merge Query can help. Step by step instructions can be found in this case study.
Q: Are there any learning resources about using custom fields in Advanced Analytics?
A: Yes. The latest case study about custom fields can be found here. We will post more tips & tricks about leveraging custom fields to address real-world use cases, so please stay tuned!
Q: How to investigate user activities in our organization and identify risky user behaviors?
A: The User Behavior Analytics (UBA) Dashboard is a good starting point. The dashboard helps you monitor anomalous user behaviors in your environment by providing high-level overviews of the UBA alerts triggered and detailed visibility into each type of UBA alerts.
If you are looking to drill into user activities, the User/Organization Unit Investigation Dashboard in our community will be a great option. This dashboard provides both high-level and detailed visibility into user activities, which helps you identify and monitor suspicious/risky user activities, e.g. PCI files uploaded through non-corporate instances, in your environment.
Q: We’re looking to find the top contributors (apps, sites, users) of the bandwidth consumption in our environment. Is there a dashboard that can be used?
A: Yes. The Transaction Events data collection in Advanced Analytics provides directional visibility into bandwidth consumption. This Web Traffic Consumption Insights - Top Contributors dashboard shows the top domains, apps, and users based on bandwidth (web traffic) consumption volume.
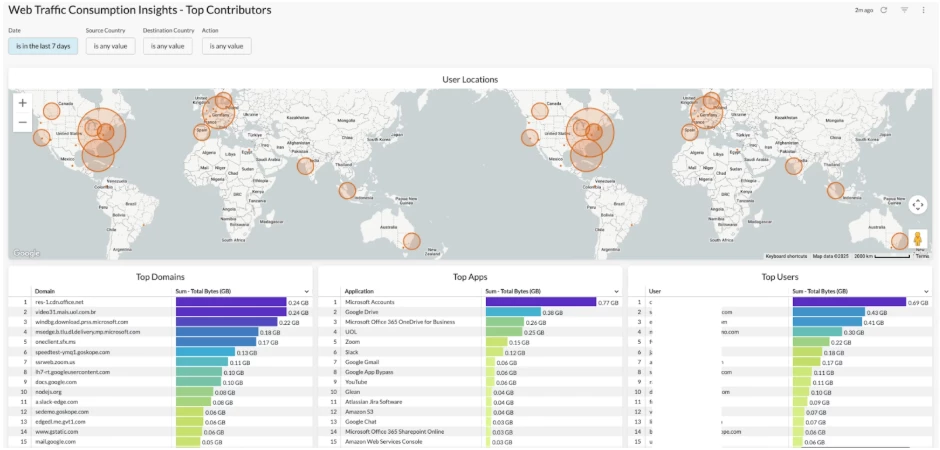
Please keep in mind that the dashboard results here are directional only. If a user has Netskope Client disabled or uninstalled, the bandwidth consumption from this user will not be captured.
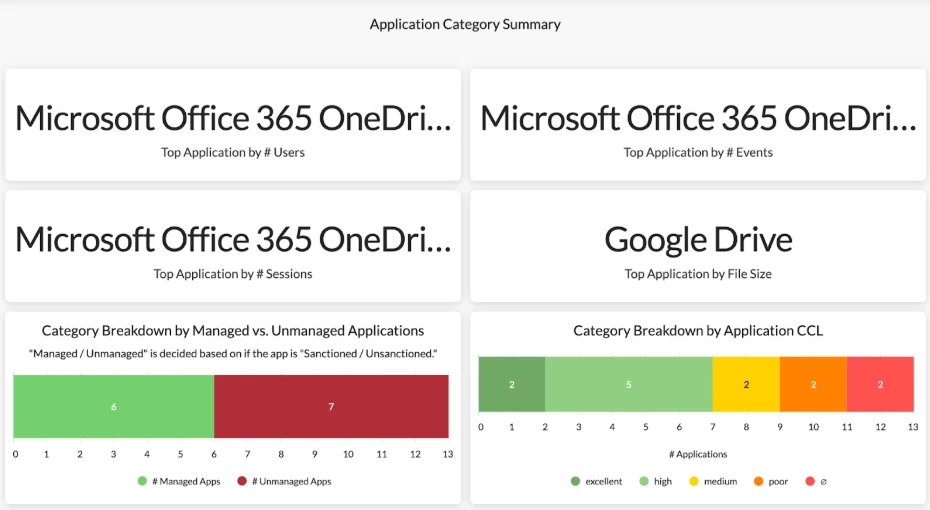
Q: How to monitor cloud app usage by division/category?
A: The Application Category Dashboard in Netskope Library is a good starting point. This dashboard provides detailed visibility into application usage by different categories in your environment, including:
- Top used applications in each category, both managed and unmanaged
- Risky application usage and data movement
- Application instance awareness
- Policies and alerts triggered by applications in each category.
Resources Shared in the Session:
Netskope Community - Advanced Analytics: https://community.netskope.com/p/advanced-analytics
Training Resources Post: https://community.netskope.com/dashboard-gallery-38/advanced-analytics-training-resources-5713?tid=5713&fid=38
Application Risk Management Dashboard:
https://community.netskope.com/dashboard-gallery-38/application-risk-management-6132
Application Instance Overview Dashboard:
CASB Health Check Dashboard V2.7:
https://community.netskope.com/dashboard-gallery-38/casb-health-check-dashboard-6075
NG-SWG Health Check Dashboard V2.8:
https://community.netskope.com/dashboard-gallery-38/ng-swg-health-check-dashboard-6104
Case Study - Merge Query:
https://community.netskope.com/discussions-37/case-study-merge-query-8104
User/Organization Unit Investigation Dashboard:
Netskope Learning Path:
https://community.netskope.com/p/netskopecustomerworkshops
Netskope Academy / Training Discussions:
https://community.netskope.com/netskope-academy-training-discussions-19
Inside Netskope: https://community.netskope.com/inside-netskope-22
Advanced Analytics Best Practices: https://docs.netskope.com/en/advanced-analytics-best-practices/
Web Traffic Consumption Insights - Top Contributors: https://community.netskope.com/dashboard-gallery-38/web-traffic-consumption-insights-top-contributors-8154?fid=38&tid=8154


