


Hello Folks,
Below you can find a recap of the topics discussed during the January Advanced Analytics office hours and those sent in that we were not able to cover in the session. Feel free to comment and continue the discussion, as well as attend our future sessions that can be found from the Community Events Calendar!
Q: There is a “Netskope recap” dashboard in the community. What is that for?
A: The 2025 Netskope Recap dashboard has been designed to help you perform an end-of-year reflection on your organization’s security posture. Topics covered include:
- Threat Protection
- Cloud App Usage Monitoring
- Policy Effectiveness Assessment
- Data Movement Investigation
- 2026 Call to Action
If you need a unified dashboard to recognize your achievements, identify areas for improvements, and ensure you’re better prepared for the evolving security challenges in 2026, use this dashboard!
Q: What is the best dashboard that we can use to continuously monitor our environment and identify emerging risks?
A: We recommend starting with the CISO Dashboard in Netskope Library. This dashboard provides high-level visibility into security concerns in your environment, including overall policy violations, threat alerts, DLP alerts, blocked traffic, & risky app usage. The period-over-period comparison allows you to easily monitor how the alert data is changing week over week.
If you need comprehensive visibility into various security metrics in your environment, our famous “health check” dashboards will be great options. There are 3 different versions of “health check” dashboards in our community.
With a focus on Netskope CASB, this dashboard covers multiple topics such as NewEdge Network, Traffic Steering, SSL Inspection, Application Risk Management, Malware Protection, and DLP, which allows you to easily identify and monitor emerging risks in your environment. Recommendations / call to actions / best practices are provided in each section, which helps you better understand how to address the risks identified & enhance your security posture correspondingly.
This dashboard shares the same purpose and use cases with the CASB Health Check Dashboard above, but focuses on Netskope NG-SWG.
Security Health Check (Self-Service) Dashboard
This is an all-in-one dashboard that allows you to perform self-service health checks and to identify security concerns/issues in your environment. The dashboard answers 2 questions: 1) How Netskope is protecting your environment; 2) What Netskope is protecting your environment from. Compared to the previous CASB and NG-SWG Health Check Dashboards that focus on monitoring risks, this dashboard focuses on quickly locating and sourcing the security concerns/issues in your environment with detailed user investigation insights.
Q: What are the recommended dashboards for DLP?
A: If your use cases focus on measuring DLP policy effectiveness and identifying policies that need to be tuned, we recommend starting with the DLP Policies Dashboard in Netskope Library. The dashboard provides visibility into DLP policies triggered, alerts generated, users triggering the alerts, and actions taken by the policies.
If your use cases focus on investigating DLP incidents, the DLP Incidents Status Monitoring Dashboard is a great starting point. The dashboard provides granular visibility into the DLP incidents in your environment, including incident status, incident resolution time, and policy details. Use this dashboard to investigate DLP incidents and monitor the incident response progress in your organization.
Q: I’m looking to surface risky/suspicious user behaviors in my environment. Any recommended dashboards?
A: We recommend starting with the Insider Threat Dashboard in Netskope Library. The dashboard highlights top risky/suspicious users based on 3 typical insider threat metrics:
- Intentional Risky Behaviors: uploads to non-corp instances and behavior analytics alerts
- Potential Data Loss: coaching policy actions and DLP policy violations
- Cloud Threats: malware, malicious sites, and compromised credentials
If you are looking to drill into suspicious user behaviors, the User Behavior Analytics (UBA) Dashboard in Netskope Library is a good starting point. The dashboard helps you monitor anomalous user behaviors in your environment by providing high-level overviews of the UBA alerts triggered and detailed visibility into each type of UBA alerts.
For more comprehensive visibility into user activities, the User/Organization Unit Investigation Dashboard in our community will be a great option. This dashboard provides both high-level and detailed visibility into user activities, which helps you identify and monitor suspicious/risky user activities, e.g. PCI files uploaded through non-corporate instances, in your environment.
Q: What dashboards can be used to monitor GenAI app usage?
A: The AI Usage Dashboard in Netskope Library provides comprehensive visibility into AI usage in your environment. Use this dashboard to identify trends/patterns of AI usage such as AI app usage trend, user group breakdown, activity summary, instance awareness, and policy action.
If you are looking for high-level data to gauge overall AI risk in your environment, the AI Risk Assessment Dashboard in Netskope Library is a great option.
Q: How to monitor overall cloud app usage in my environment and identify risky app usage?
A: For overall cloud app usage, the SaaS Visibility Dashboard in Netskope Library is a great starting point. It provides insights into SaaS app adoption through the lens of app, user, & data risk. Use this dashboard to monitor risky apps being used, suspicious data movement to non-corporate instances, and user identities detected.
If you are looking to drill into suspicious/risky cloud app usage, the Application Risk Management Dashboard is a great option. This dashboard helps you better understand:
- What risky & unmanaged apps are being used in your environment
- If there is any sensitive data movement to these risky & unmanaged apps
- If there are any unsanctioned or non-corporate app instances in use and the corresponding user activities
Q: In my custom dashboard, I am not getting more than 5000 records? What is the upper limit for the record count?
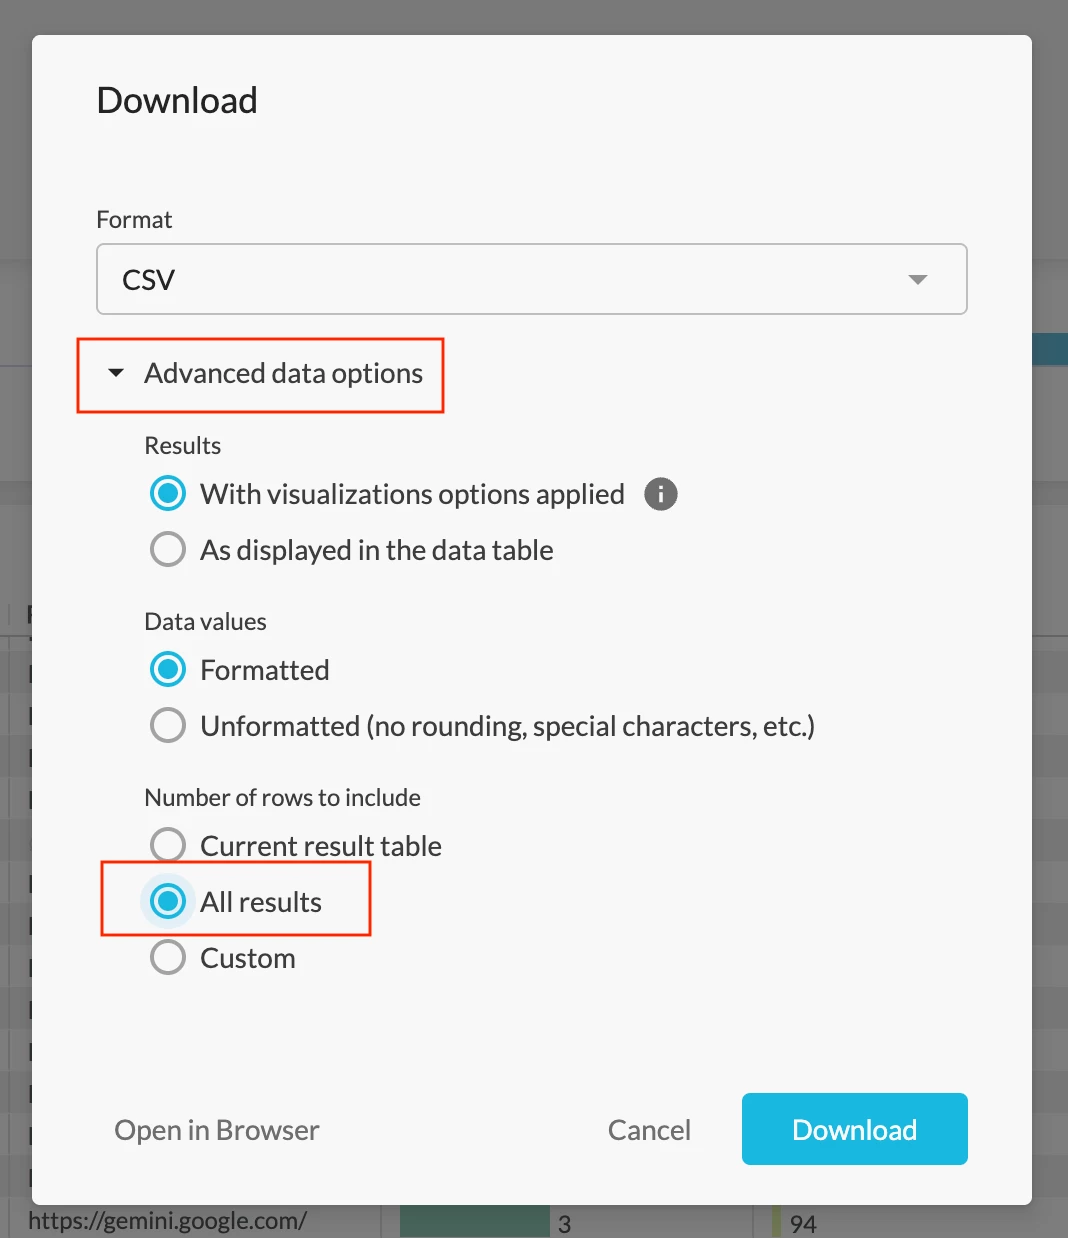
A: By default, all widgets in Advanced Analytics have a 5,000 row limit. However, full results can be downloaded from the widgets you need.
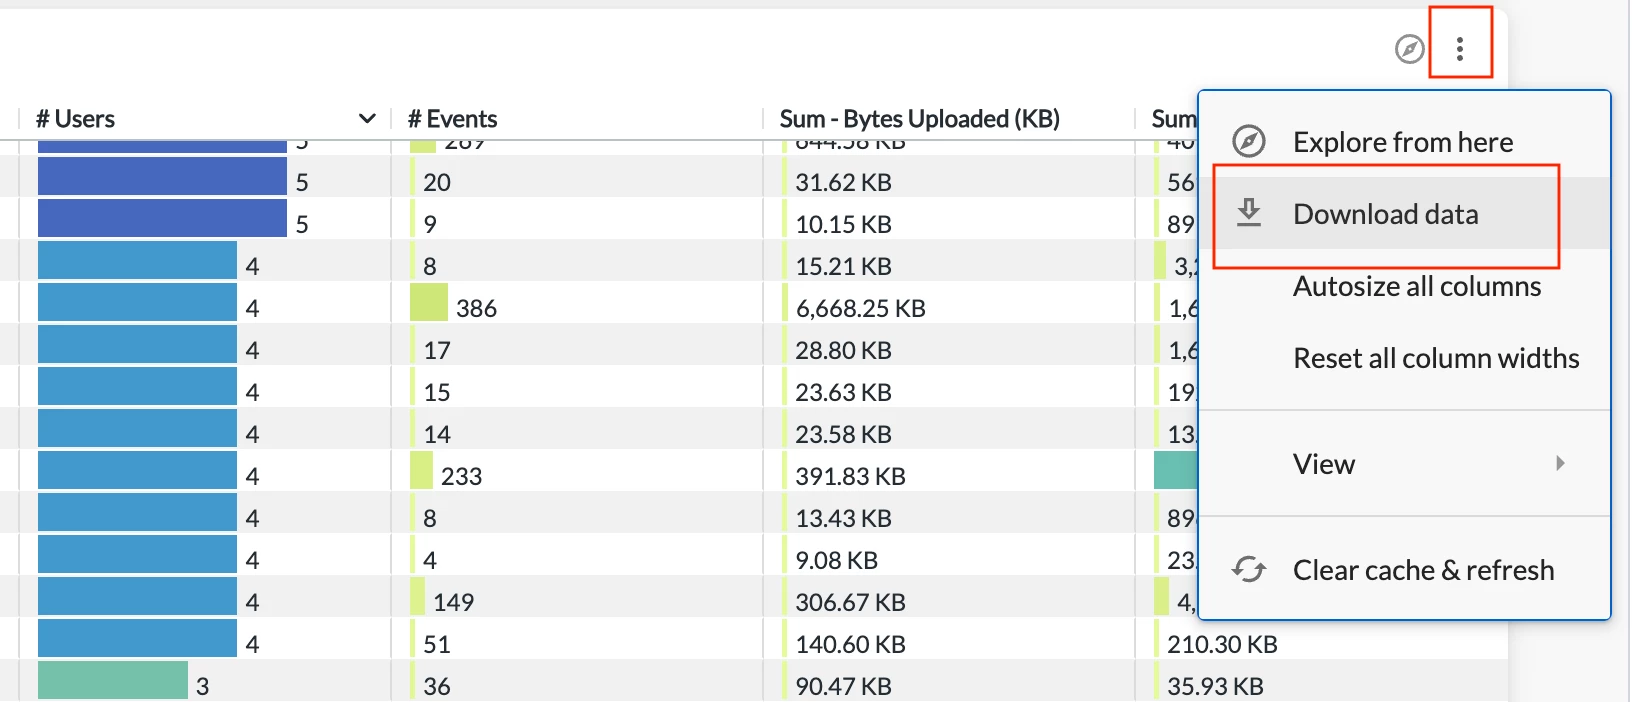
To download full results, expand “Advanced data options” in the download menu and select “All results.” This will allow you to download all records without the row limit.
Q: Does the top dashboard filter win over the widget filter?
A: Yes. In Advanced Analytics, dashboard level filters take precedence over widget level filters. More details about filters can be found in this video.
Q: Is there a dashboard for private apps?
A: Yes. The Private Application Overview dashboard in Netskope Library is a great option. The dashboard helps you better understand private app usage in your environment by providing visibility into app info, user info, publisher info, traffic volume, and policies triggered.
Resources Shared in the Session
Netskope Community - Advanced Analytics: https://community.netskope.com/p/advanced-analytics
Training Resources Post: https://community.netskope.com/dashboard-gallery-38/advanced-analytics-training-resources-5713?tid=5713&fid=38
2025 Netskope Recap:
https://community.netskope.com/dashboard-gallery-38/2025-netskope-recap-8370
CASB Health Check Dashboard V2.7:
https://community.netskope.com/dashboard-gallery-38/casb-health-check-dashboard-6075
NG-SWG Health Check Dashboard V2.8:
https://community.netskope.com/dashboard-gallery-38/ng-swg-health-check-dashboard-6104
Security Health Check (Self-Service) Dashboard V2:
Endpoint DLP Monitoring Dashboard:
https://community.netskope.com/dashboard-gallery-38/endpoint-dlp-monitoring-dashboard-7989
Webmail SMTP DLP Dashboard:
https://community.netskope.com/dashboard-gallery-38/webmail-smtp-dlp-insights-7988
User/Organization Unit Investigation Dashboard:
Application Risk Management Dashboard:
https://community.netskope.com/dashboard-gallery-38/application-risk-management-6132
Application Instance Overview Dashboard - Instance Tags:
Enterprise Browser Usage Monitoring Dashboard:
Enterprise Browser Usage Monitoring - Risk & Control:


