


Hello Folks,
Below you can find a recap of the topics discussed during the September Advanced Analytics office hours and those sent in that we were not able to cover in the session. Feel free to comment and continue the discussion, as well as attend our future sessions that can be found from the Community Events Calendar!
Q: We saw CASB, NG-SWG, and Self-Service health check dashboards in Netskope community. What’s the difference and how to best use each of them?
A: There are 3 different “health check” dashboards with different purposes & use cases in our community:
The purpose of this dashboard is to help you maximize the ROI of your Netskope investment and to ensure you are using Netskope products to their full potential. With a focus on CASB, the dashboard covers multiple topics such as NewEdge Network, Traffic Steering, SSL Inspection, Application Risk Management, Malware Protection, and DLP, which answers the question “how Netskope is protecting your environment.” Recommendations / call to actions / best practices are provided in each section, which helps you better understand how to mitigate the security concerns & issues identified in the dashboard.
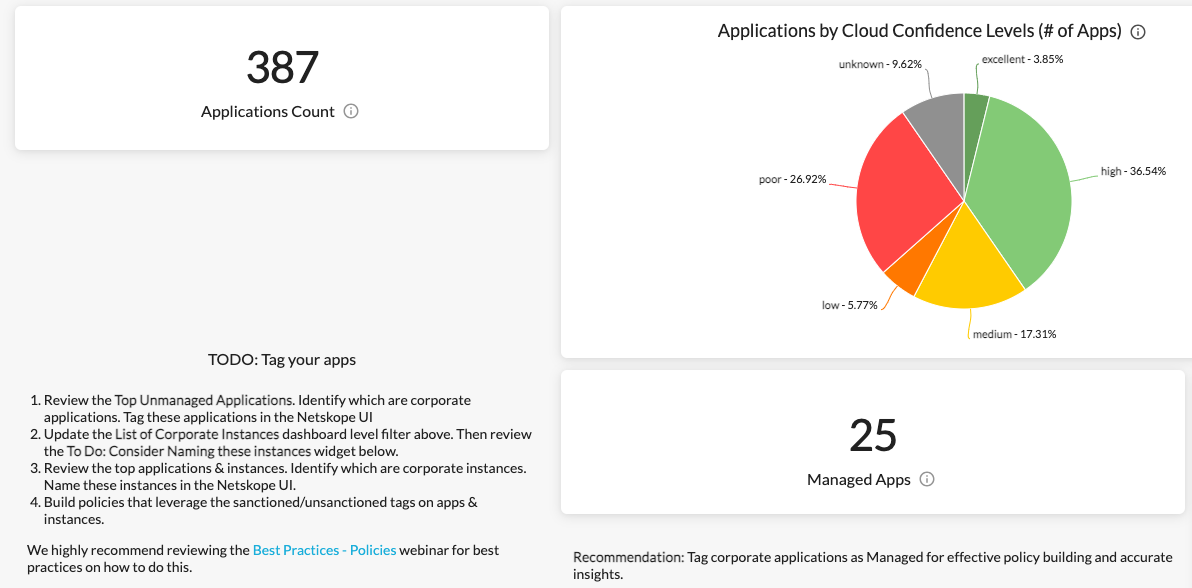
A typical use case with this dashboard is “executive / leadership reporting.” If you need a dashboard to justify the ROI of your Netskope investment or to highlight the value of your team’s achievements to your leadership, this is a great option. The dashboard is also a good starting point if you are new to Advanced Analytics.
This dashboard shares the same purpose and use cases with the CASB Health Check Dashboard above, but focuses on NG-SWG.
Security Health Check (Self-Service) Dashboard
This is an all-in-one dashboard which allows you to perform self-service health checks and to identify security concerns / issues in your environment. The dashboard answers 2 questions: 1) How Netskope is protecting your environment; 2) What Netskope is protecting your environment from.
Compared to the previous CASB and NG-SWG Health Check Dashboards that focus on showcasing business values, this dashboard focuses on quickly locating security concerns / issues in your environment.
More topics such as Device & Client Management, Alerts, and Policies are covered in this dashboard, which provides a high-level overview of your entire environment.
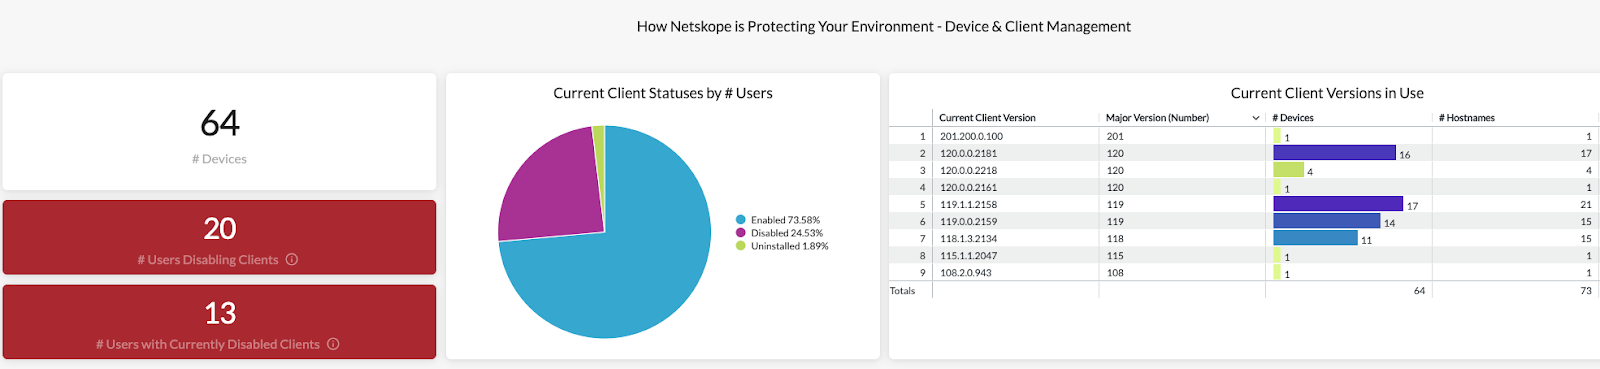
“User investigation” tables are also included, which helps you source all the risky traffic in your environment.
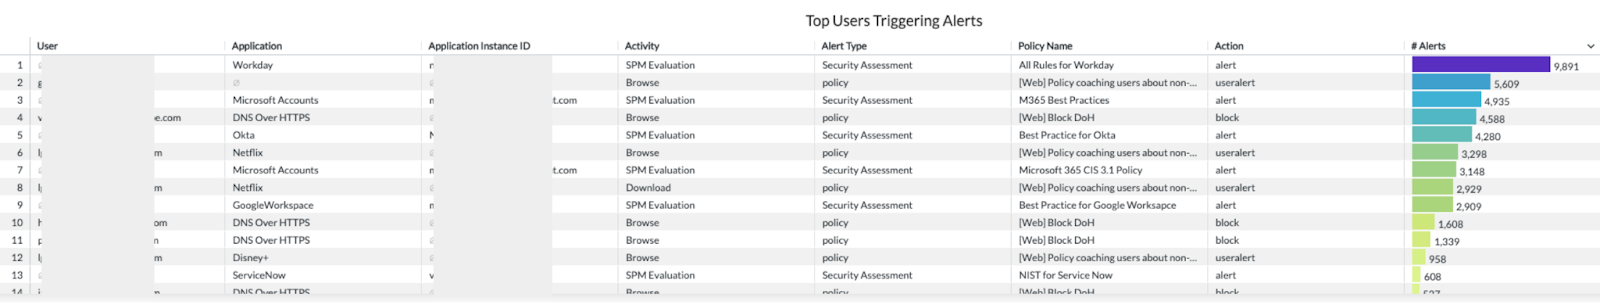
A typical use case with this dashboard is “threat hunting / troubleshooting.” If you observe some unexpected / anomalous data (e.g. an extremely high number of DLP alerts triggered in the past 7 days) and want to understand why this is happening, this dashboard is a great option. You can also leverage this dashboard to perform regular health checks to your environment.
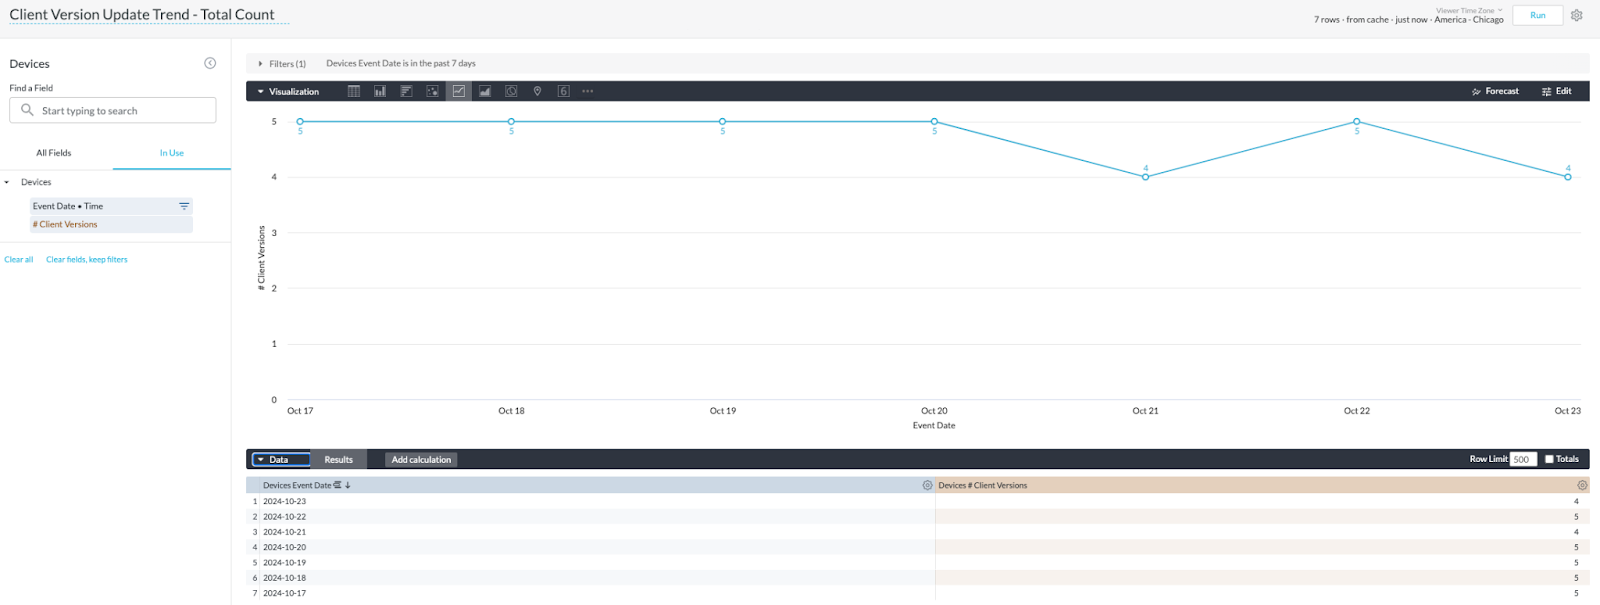
Q: Looking to view client versions per day. Currently the Device Client Overview - Client Version Trend shows the micro trend but not the total count per day.
A: To get the trend of the total client version count, we can apply the pre-defined measure “# Client Versions” with the dimension “Event Date.” By selecting “Line” as the visual type, we will get a line chart showing the total client version count by date.
Q: Looking for best practices for creating new / custom measures.
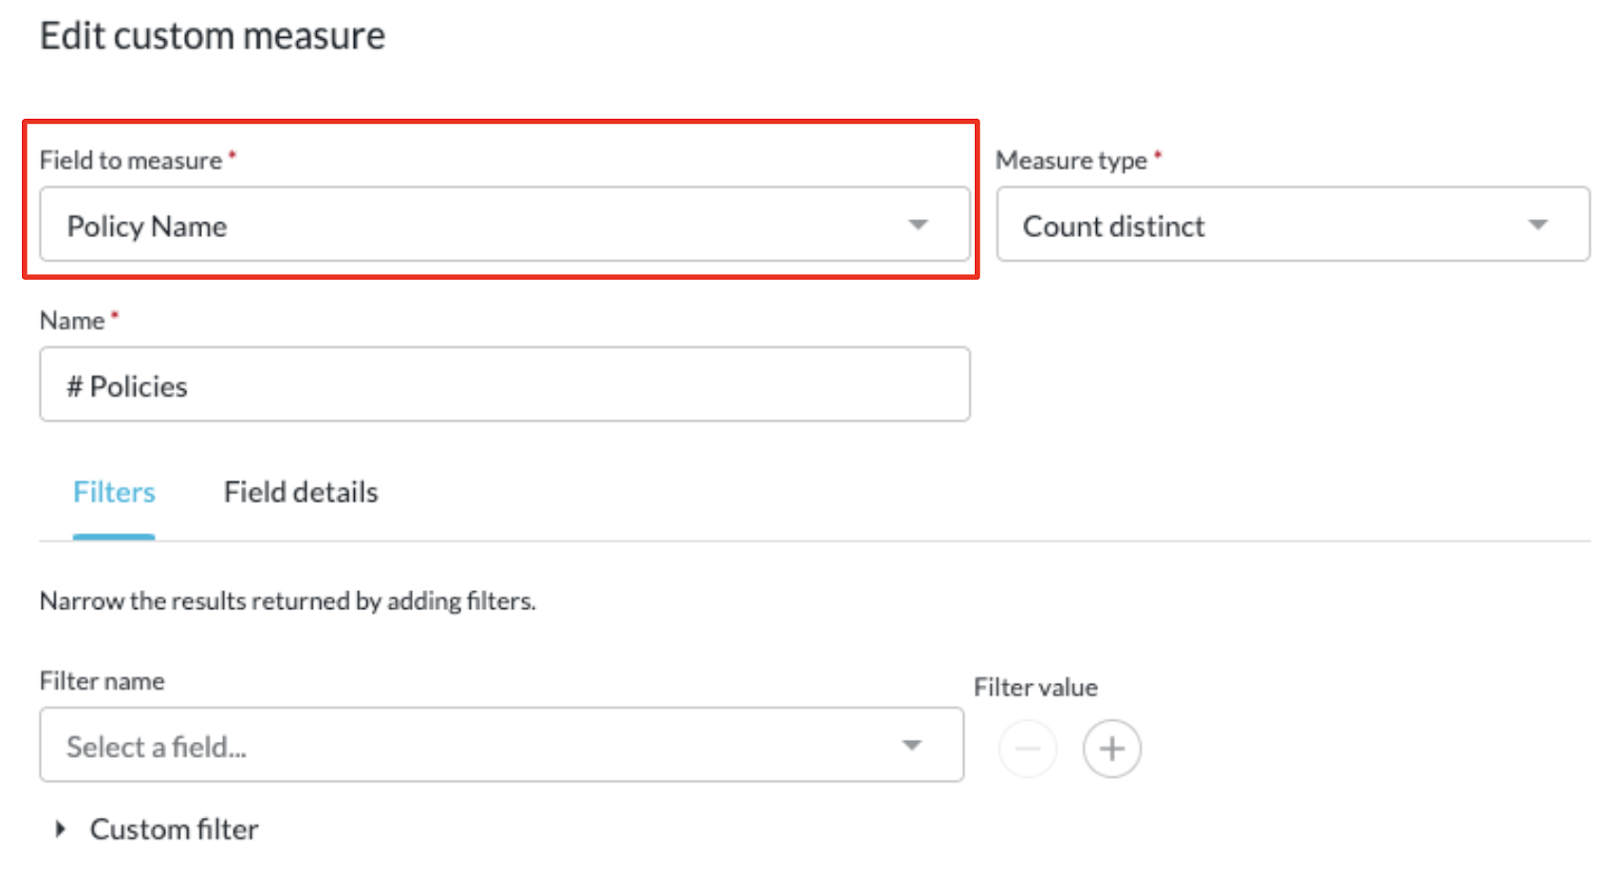
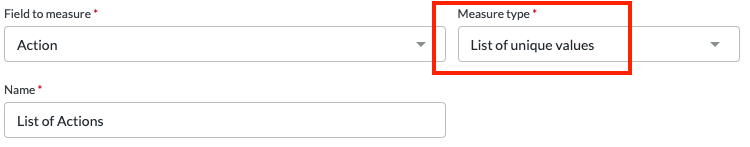
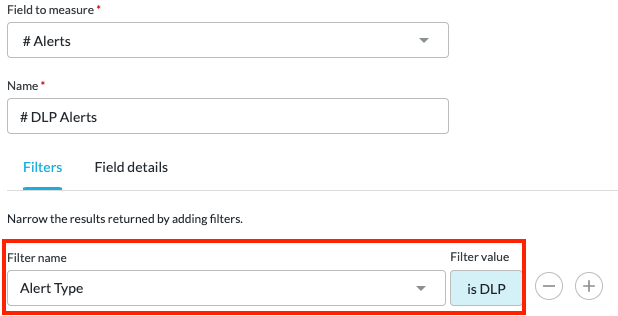
A: Although Advanced Analytics provides multiple pre-defined measures that can be used directly, custom measures allow you to aggregate the data in different ways based on your use cases. When creating a custom measure, 3 parameters need to be configured:
Field to measure
This is the data you want to aggregate.
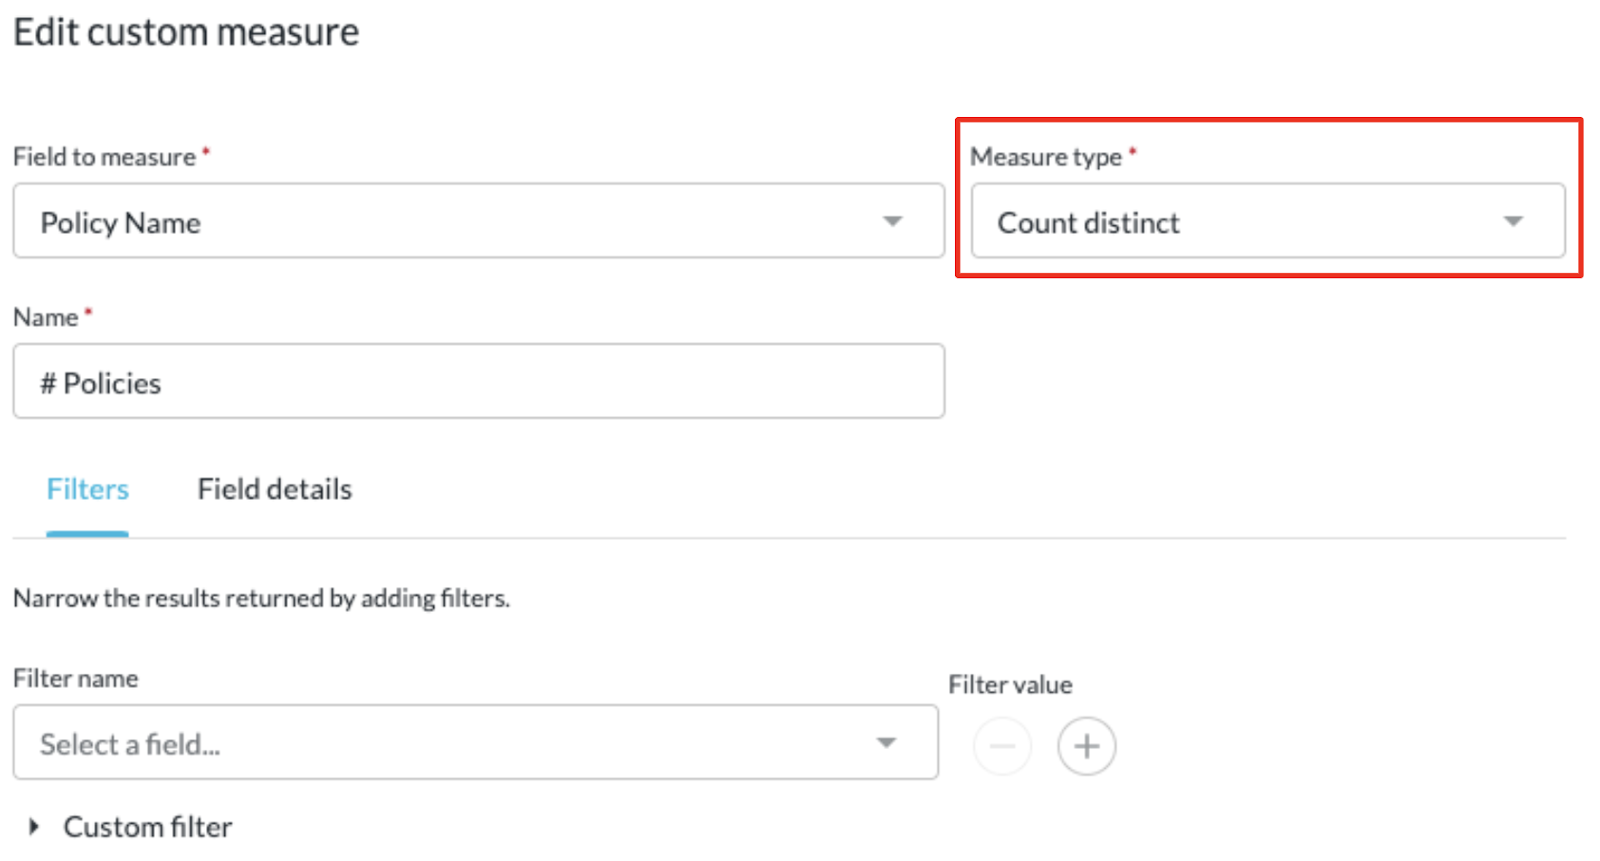
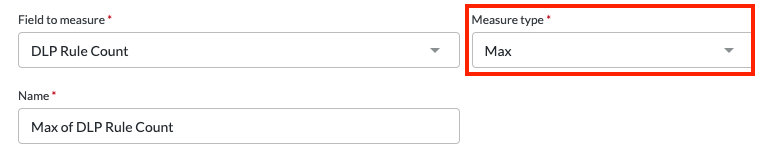
Measure type
This decides how the data will be aggregated.
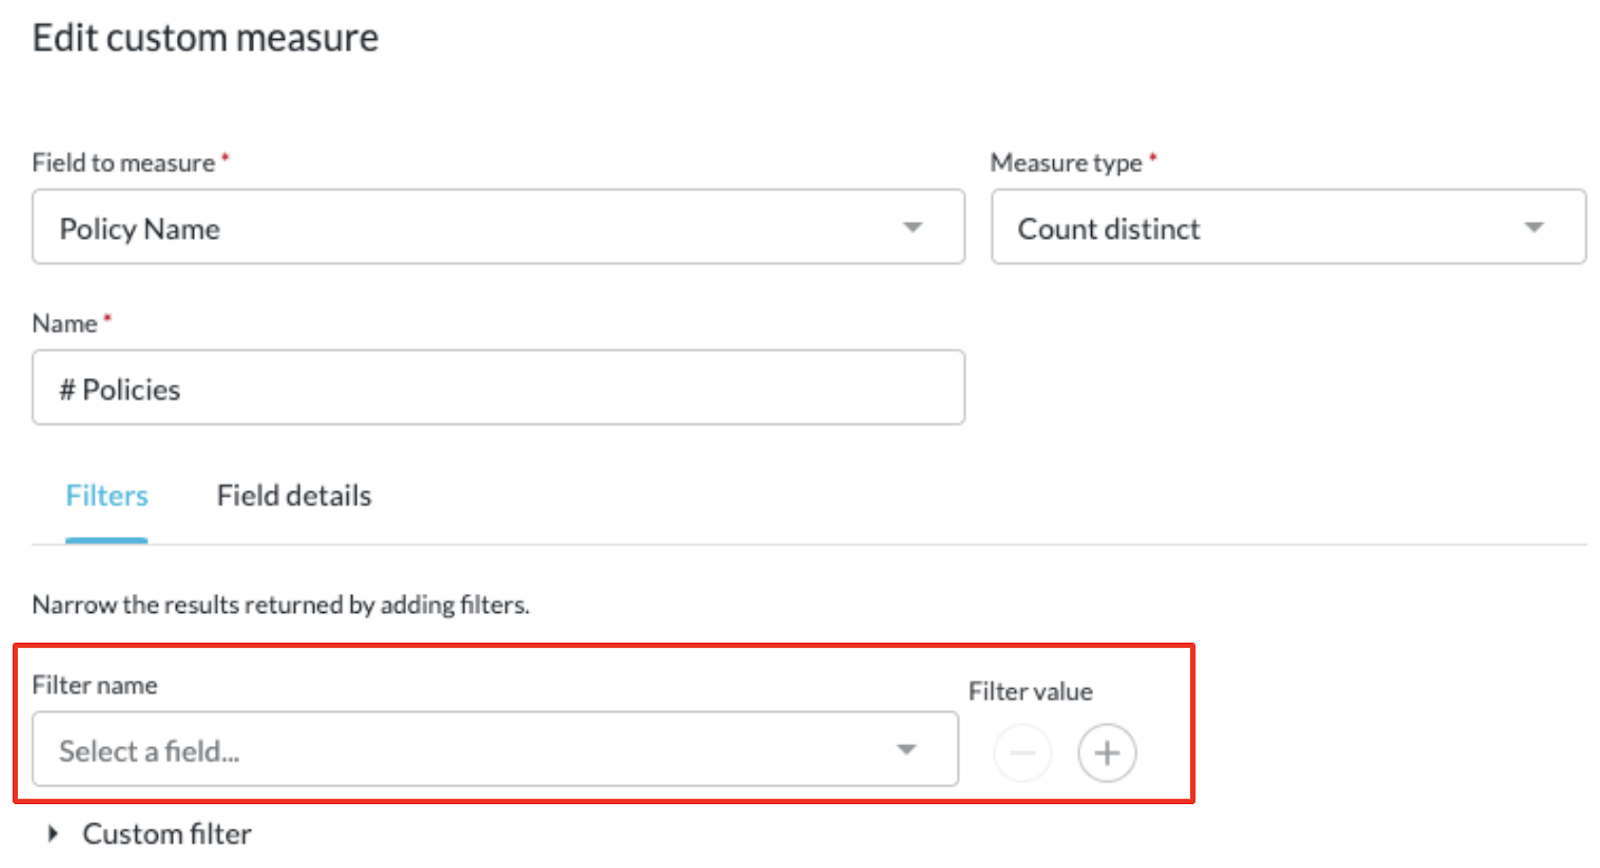
Filters
This allows you to apply particular filters to your data.
There are 4 typical uses cases with custom measures:
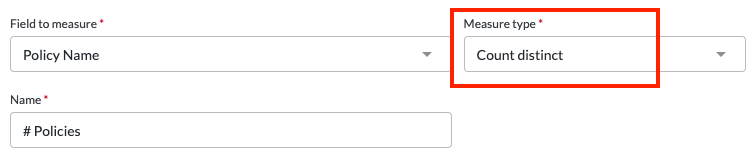
Count distinct which returns the unique count of data from a field. E.g. The unique count of policies triggered.
List of unique values which lists all data from a field. E.g. The list of all actions taken by a policy.
Filtered measure which allows you to apply filters to an existing measure. E.g. The unique count of alerts with Alert Type = DLP.
Data calculation which allows you to run simple calculations on the data. E.g. The max value of DLP rule hit count.
There are many other ways to configure a custom measure. Feel free to explore and share!
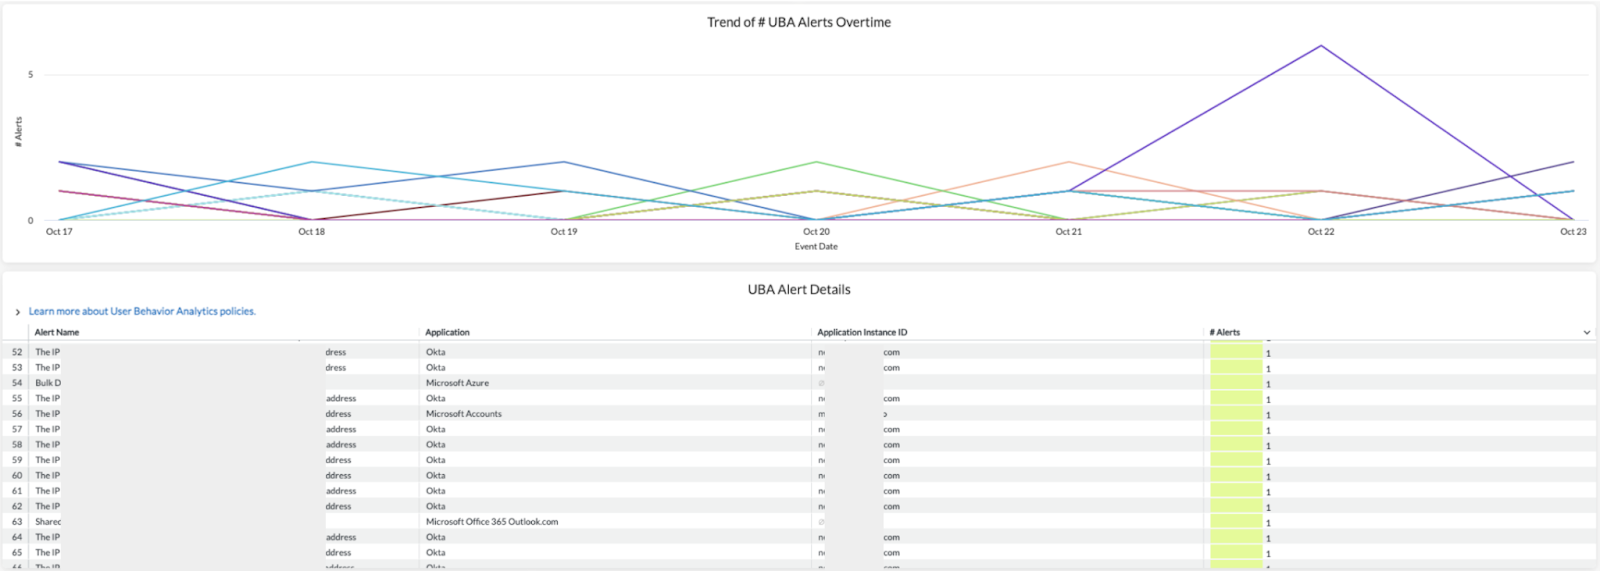
Q: Are there any dashboards available for UBA reporting?
A: Yes. Currently, there are 2 behavior analytics dashboards ready to be used.
If you focus on Standard UEBA only, the User Behavior Analytics (UBA) Dashboard in Netskope Library is a good starting point. The dashboard helps you monitor anomalous user behaviors in your environment by providing high-level overviews of the UBA alerts triggered and detailed visibility into each type of UBA alerts.
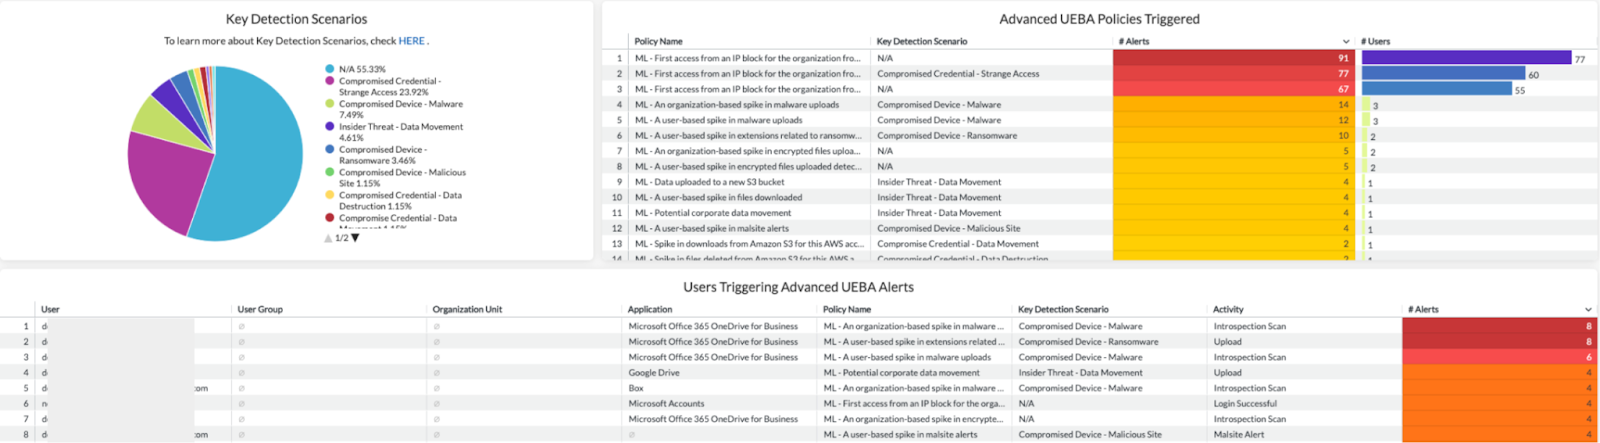
If you focus more on Advanced UEBA, the Advanced UEBA Dashboard in Netskope Community is a great option. This dashboard provides detailed visibility into the alerts generated by Advanced UEBA (machine learning based) policies, which helps you perform user investigation & alert validation on this topic. With the dashboard, you can better understand why these alerts are triggered and if your policies are working effectively.
Q: How can I view the allowed and blocked sites in my environment? We’re trying to identify users visiting phishing sites without being blocked.
A: The Top Allowed & Blocked Websites Dashboard in Netskope Community can help. This is a simple dashboard that allows you to view top allowed & blocked websites in your environment. You can also highlight phishing site visits by adding the “Category” filter.
Q: Is there a starting point dashboard which can be used to monitor data flow in our environment?
A: Yes. The Data Flow Investigation Dashboard in Netskope Community is a great option. This dashboard helps you better view how data is moving in your organization by answering the questions:
- Who are the top users moving data and where are they moving the data to?
- Who is uploading or downloading data into specific applications, such as Box?
- What are the activities taking place in a specific application, such as Google Drive?
- Where is a specific user moving data from and to?
Links shared in the session:
Netskope Community - Advanced Analytics: https://community.netskope.com/p/advanced-analytics
Training Resources Post: https://community.netskope.com/dashboard-gallery-38/advanced-analytics-training-resources-5713?tid=5713&fid=38
CASB Health Check Dashboard:
NG-SWG Health Check Dashboard:
https://community.netskope.com/dashboard-gallery-38/updated-ng-swg-health-check-dashboard-6104
Security Health Check (Self-Service) Dashboard:
Custom Dimensions & Measures:
https://community.netskope.com/video-library-20/advanced-custom-fields-5794
Advanced UEBA Dashboard:
https://community.netskope.com/dashboard-gallery-38/advanced-ueba-dashboard-6944
P-DEM Resources:
https://docs.netskope.com/en/proactive-digital-experience-management/
P-DEM Enterprise Demo Video:
P-DEM Use Cases:
NPA Troubleshooting:
https://netskopeclient.learnupon.com/users/sign_in?next=%2Fcatalog%2Fcourses%2F3246221
Top Allowed & Blocked Websites Dashboard:
Data Flow Investigation Dashboard:
https://community.netskope.com/dashboard-gallery-38/data-flow-investigation-dashboard-6382


