


Hello Folks,
Below you can find a recap of topics discussed during the July Advanced Analytics Office Hours and those sent in that we were not able to cover in the session. Feel free to comment and continue the discussion, as well as attend our future sessions that can be found from the Community Events Calendar!
Q: How to detect and monitor sensitive data (PII, PCI, PHI) movement?
A: A: Our Data Flow Investigation Dashboard V2 can help. The dashboard provides both high-level and granular visibility into the data movement in your environment from 3 dimensions: geolocation data flow (web transaction), cloud application data flow (app events), and endpoint data flow (endpoint traffic).
Together with this, we also provide a supplemental Control & Monitor Dashboard that helps you monitor sensitive data movement in your environment and better understand how Netskope DLP is controlling the sensitive data movement.
To customize the dashboards with a focus on particular data types like PII, PCI, & PHI, simply apply the “DLP Profile” filter and set it to the data types you’re interested in.
Q: I’d like to hear more about what usage metrics can be obtained in relation to generative and agentic AI usage.
A: To monitor generative AI usage and uncover risky user activities, the AI Usage Dashboard in Netskope Library is a great starting point. The dashboard provides comprehensive visibility into AI app usage and site visits in your environment. Key metrics include AI app overview & usage trend, detailed user activities, instance awareness, policy actions, and web traffic generated in AI sites.
For visibility into agentic AI, our latest Agentic Broker Dashboard for Securing MCP will be a great option. The dashboard provides rich visibility into MCP usage in your environment, including MCP server access, MCP client usage, and MCP tool invocation.
Q: What are the recommended dashboards for SWG and NPA?
A: NG-SWG Health Check Dashboard is a great option for SWG. It is a consolidated dashboard that provides comprehensive visibility into SWG metrics including NewEdge Network, Traffic Steering, Client Overview, SSL Inspection, Cloud Threats, AUP, and RBI.
For NPA, the Private Application Overview Dashboard in Netskope Library is a great option. It helps you monitor NPA usage in your environment with visibility into private apps detected, user info, publisher usage, traffic volume, and policies triggered.
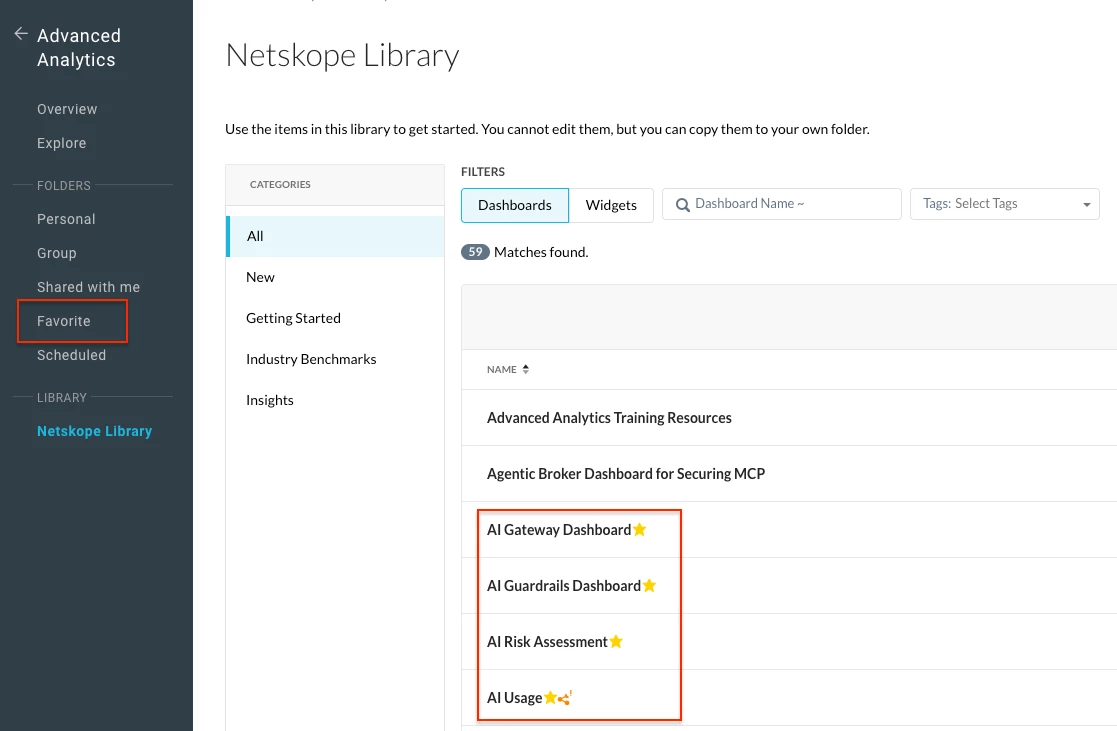
Q: Is there a way to favorite or pin certain dashboards in Advanced Analytics?
A: Yes. To favorite a dashboard, simply click the “star” button next to the dashboard title, then the dashboard will be saved to your “Favorite” folder.
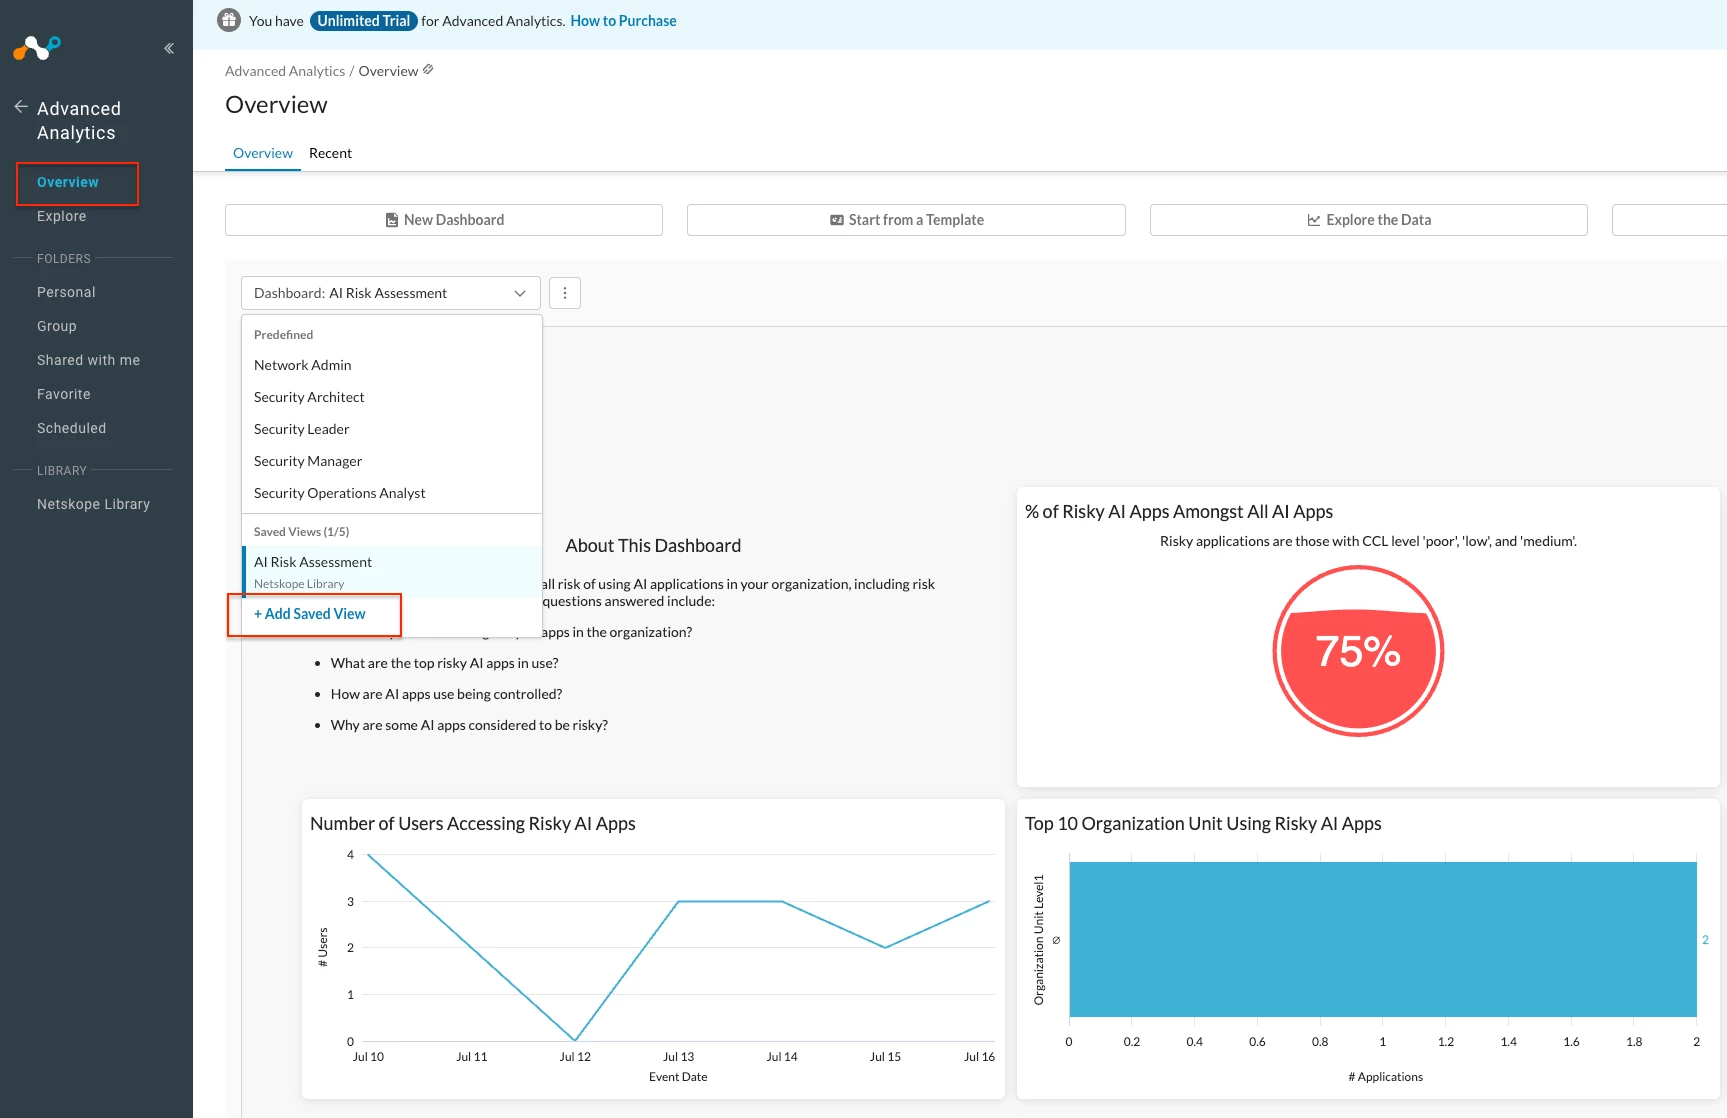
To pin a dashboard, expand the drop-down menu on your “Overview” page and hit “+ Add Saved View.” You’ll then be able to select and pin a dashboard based on your needs.
Q: How to better monitor user behaviors (event peaks, uploads/downloads) using Advanced Analytics?
A: We recommend starting with the User Behavior Analytics (UBA) Dashboard in Netskope Library. The dashboard helps you monitor anomalous user behaviors in your environment by providing detailed visibility into different types of behavior analytics alerts, including compromised credentials.
If you are looking to drill into user behaviors, the User/Organization Unit Investigation Dashboard in our community will be a great option. This dashboard helps you investigate suspicious user behaviors in your environment, e.g., file uploads to non-corporate instances.
Q: How to monitor app usage with CCI index? How to visualize app usage where "customer data is shared for learning purposes?"
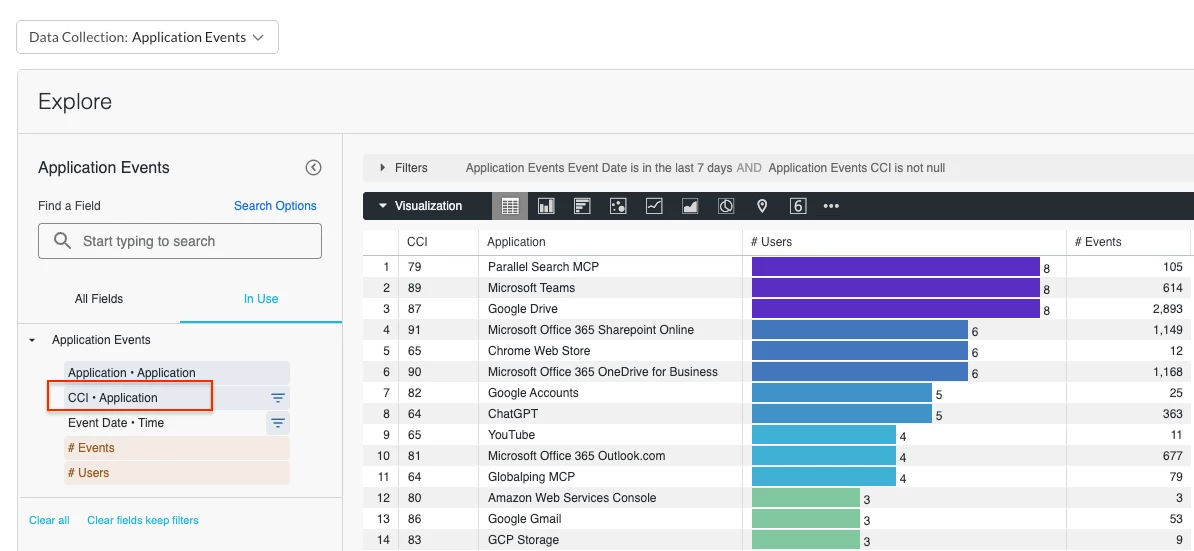
A: To monitor app usage with CCI index, start with Application Events and add the “CCI” field to your widget together with any other fields you need.
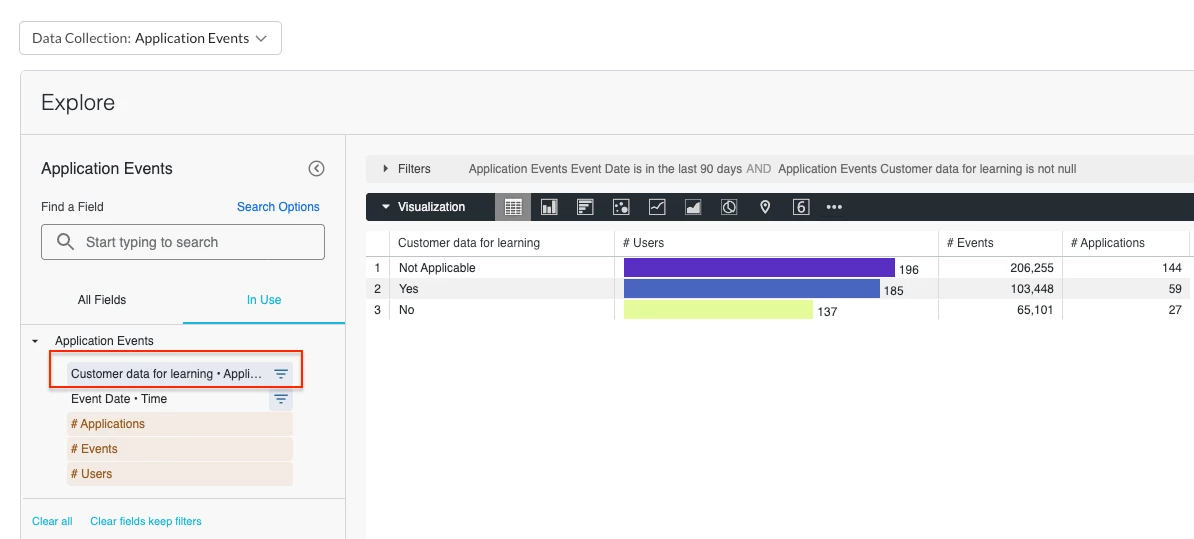
Our CCI attributes can help you uncover app usage where customer data is shared for learning purposes. By adding the “Customer data for learning" field, you can monitor app usage metrics based on apps sharing customer data for learning purposes and reprioritize your app evaluation as needed.
Q: How to evaluate Shadow IT risk like sanctioned vs. unsanctioned AI app usage?
A: The Application Risk Management Dashboard is a great starting point to evaluate and monitor Shadow IT. The dashboard helps you better understand:
- What risky & unsanctioned apps are being used in your environment
- If there is any sensitive data movement to these risky & unmanaged apps
- If there are any unsanctioned or non-corporate app instances in use and the corresponding user activities
Q: How to best use Transaction Events and how is it different from the other events?
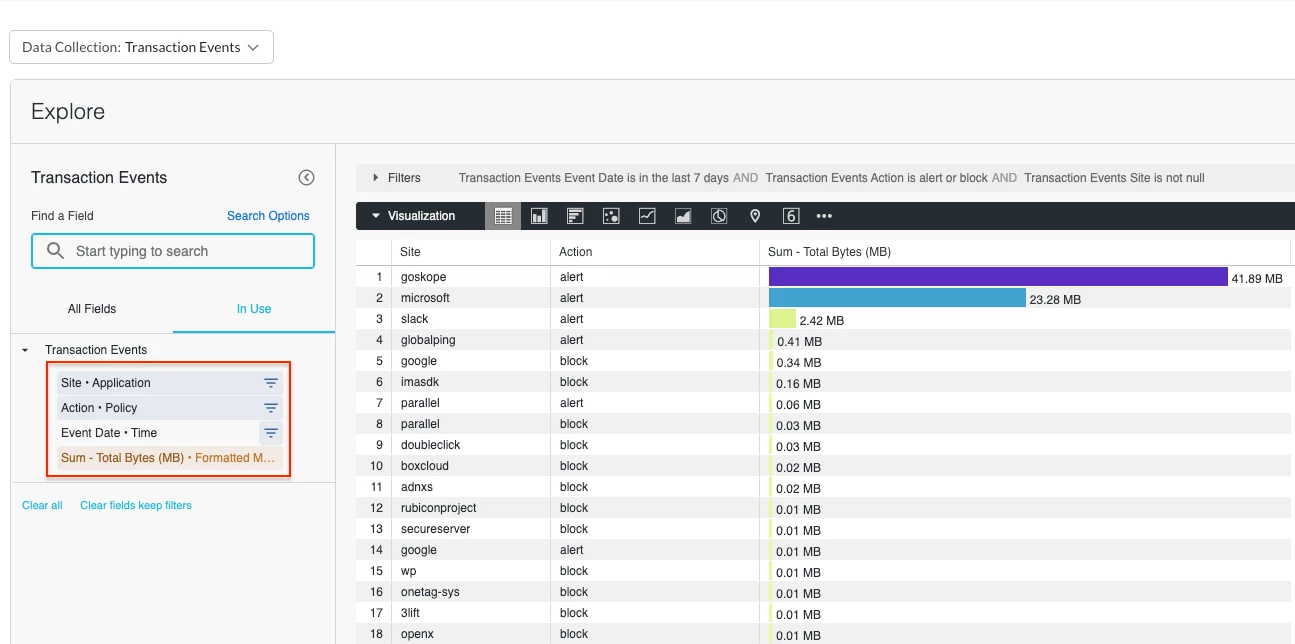
A: Netskope already provides App Events, Page Events, etc. that are rolled up and summarized to avoid “noisy” web traffic. The rolled up view is great for high-level data monitoring & analysis; in addition, Transaction Events provides granular visibility into the web traffic generated in your environment, which is recommended for in-depth data analysis.
One of the most popular use cases with Transaction Events is site visit monitoring; you can easily view sites being visited by users in your environment and identify blocked/alerted sites.
Q: Is there a way to use the DEM metrics for building a dashboard in Advanced Analytics?
A: No. While Advanced Analytics is developed with a focus on security use cases, DEM focuses on performance use cases. Advanced Analytics and DEM do not share the same data source, so DEM metrics cannot be used for building a dashboard in Advanced Analytics.
Resources shared in the session:
Netskope Community - Advanced Analytics: https://community.netskope.com/p/advanced-analytics
Training Resources Post: https://community.netskope.com/dashboard-gallery-38/advanced-analytics-training-resources-5713?tid=5713&fid=38
Data Flow Investigation Dashboard V2:
https://community.netskope.com/dashboard-gallery-38/data-flow-investigation-dashboard-v2-7986
Data Flow Investigation Dashboard V2 - Control & Monitor:
MCP Dashboard:
https://community.netskope.com/dashboard-gallery-38/agentic-broker-dashboard-for-securing-mcp-8762
AI Gateway Dashboard: https://community.netskope.com/dashboard-gallery-38/ai-gateway-dashboard-8660
NG-SWG Health Check Dashboard:
https://community.netskope.com/dashboard-gallery-38/updated-ng-swg-health-check-dashboard-6104
User/Organization Unit Investigation Dashboard:
Application Risk Management Dashboard:
https://community.netskope.com/dashboard-gallery-38/application-risk-management-6132